 Global| Oct 01 2020
U.S. Initial Unemployment Insurance Claims Decline; Rate Lowest Since Late March
Summary
• Seasonally adjusted initial claims in state programs fell 36,000 in September 26 week to 837,000; not seasonally adjusted claims fell 40,300 to 786,900. • PUA program initial claims rose 34,521 to 650,120. • Insured unemployment [...]
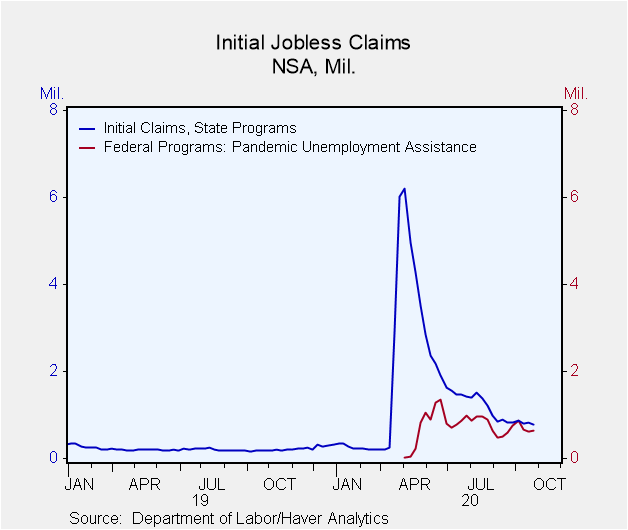
• Seasonally adjusted initial claims in state programs fell 36,000 in September 26 week to 837,000; not seasonally adjusted claims fell 40,300 to 786,900.
• PUA program initial claims rose 34,521 to 650,120.
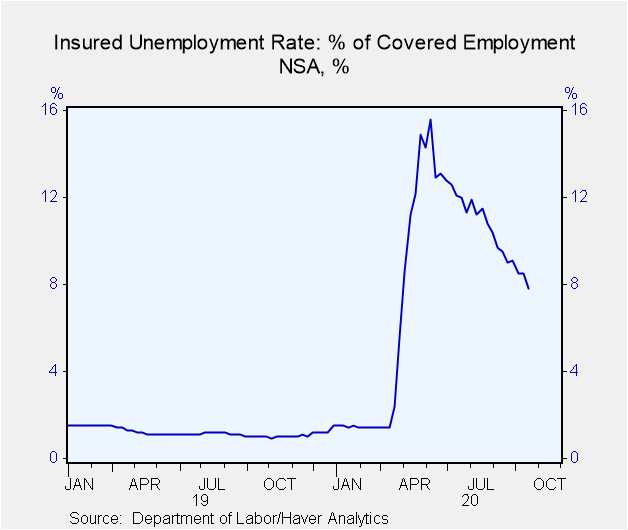
• Insured unemployment rate in September 19 week was 8.1%, lowest since 5.1% in late March.
Initial claims for unemployment insurance in standard state programs decreased 36,000 in the week ended September 26 to 837,000 seasonally adjusted (+284% y/y) from 873,000 the week before; that September 19 data was revised upward marginally from 870,000 reported last week. The Action Economics Forecast Survey had again expected 850,000. While the latest week's total is still outsized, it is the lowest since the 282,000 in the March 14 week just before the pandemic set in.
As we have mentioned here in recent weeks, the Department of Labor now uses additive seasonal factors in its seasonal adjustment process. But data prior to August 29 still utilize the multiplicative seasonals. So Haver has calculated a series with additive seasonal factors throughout history; the official Labor Department series will be reconciled when standard adjustments are made in January. Not seasonally adjusted data fell in the September 26 week to 786,900 initial claims from 827,200 the week before.
The special pandemic-related initial claims increased 35,000 in the September 26 week to 650,000 from 616,000 the week before [rounding issues affect arithmetic here]; that tally was revised down from 630,000 to 616,000. This program reaches "gig workers" or others unemployed who are not ordinarily associated with companies or other organizations giving them access to standard unemployment insurance.
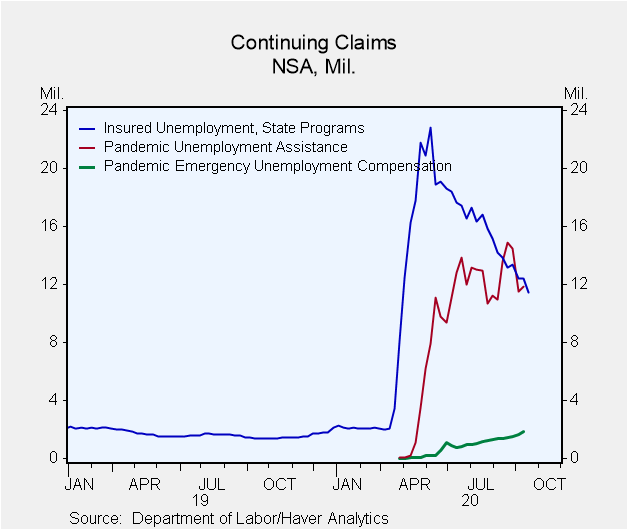
Continuing claims for standard unemployment insurance declined 980,000 in the September 19 week to 11.767 million. This is the lowest since 7.446 million at the end of March. The number of people receiving Pandemic Unemployment Assistance (PUA) benefits rose 317,000 in the September 12 week to 11.828 million. The number of Pandemic Emergency Unemployment Compensation (PEUC) recipients rose 197,000 in that week to 1.828 million from 1.632 million the week before.
The insured unemployment rate was 8.1% in the September 19 week, down from 8.7% the previous week. This includes the standard state programs only. This is the lowest since 5.1% in the March 28 week, just as the pandemic-associated claims were building up.
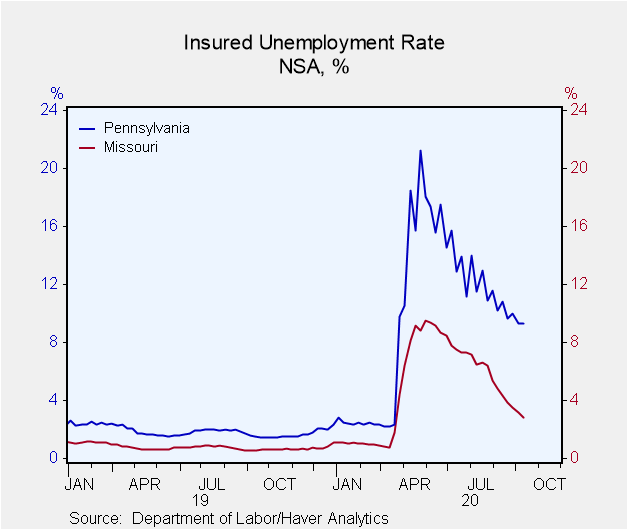
Among the states, the basic insured unemployment rates continue with extreme variation. The five lowest rates were in Idaho (1.44%), South Dakota (1.66%), Utah (1.91%), Alabama (1.93%) and Nebraska (2.24%). The five highest rates were in Louisiana (12.63%), New York (13.73%), Nevada (14.65%), California (16.11%) and Hawaii (21.34%). A total of 11 states had rates above 10%.
Note: California has announced a two week pause in its processing of claims to reduce its claims processing backlog and implement fraud prevention technology. Initial claims data from September 19 and continuing claims data from September 12 will be repeated in the weeks that follow until completion of the pause.
Data on weekly unemployment claims going back to 1967 are contained in Haver's WEEKLY database, and they are summarized monthly in USECON. Data for individual states are in REGIONW. The expectations figure is from the Action Economics Forecast Survey, carried in the AS1REPNA database.
| Unemployment Insurance (SA, 000s) | 09/26/20 | 09/19/20 | 09/12/20 | Y/Y % | 2019 | 2018 | 2017 |
|---|---|---|---|---|---|---|---|
| Initial Claims | 837 | 873 | 866 | 284 | 218 | 221 | 244 |
| Initial Claims (NSA) | 787 | 827 | 796 | 355 | 218 | 221 | 243 |
| Initial Claims Pandemic Unemployment Assistance (NSA) | 650 | 616 | 675 | -- | -- | -- | -- |
| Continuing Claims | -- | 11,767 | 12,747 | 606 | 1,701 | 1,756 | 1,961 |
| Continuing Claims (NSA) | -- | 11,411 | 12,431 | 725 | 1,704 | 1,763 | 1,964 |
| Continuing Claims Pandemic Unemployment Assistance (NSA) | -- | -- | 11,828 | -- | -- | -- | -- |
| Insured Unemployment Rate (%) | -- | 8.1 | 8.7 |
1.2 |
1.2 | 1.2 | 1.4 |
Carol Stone, CBE
AuthorMore in Author Profile »Carol Stone, CBE came to Haver Analytics in 2003 following more than 35 years as a financial market economist at major Wall Street financial institutions, most especially Merrill Lynch and Nomura Securities. She has broad experience in analysis and forecasting of flow-of-funds accounts, the federal budget and Federal Reserve operations. At Nomura Securites, among other duties, she developed various indicator forecasting tools and edited a daily global publication produced in London and New York for readers in Tokyo. At Haver Analytics, Carol is a member of the Research Department, aiding database managers with research and documentation efforts, as well as posting commentary on select economic reports. In addition, she conducts Ways-of-the-World, a blog on economic issues for an Episcopal-Church-affiliated website, The Geranium Farm. During her career, Carol served as an officer of the Money Marketeers and the Downtown Economists Club. She has a PhD from NYU's Stern School of Business. She lives in Brooklyn, New York, and has a weekend home on Long Island.


