 Global| Jul 24 2008
U.S. Initial Unemployment Insurance Claims Shoot Back Up
by:Tom Moeller
|in:Economy in Brief
Summary
Initial claims for unemployment insurance shot higher last week to 406,000. The latest level compared to an upwardly revised 372,000 during the prior week. It reached a level not seen since this past March which was the highest point [...]
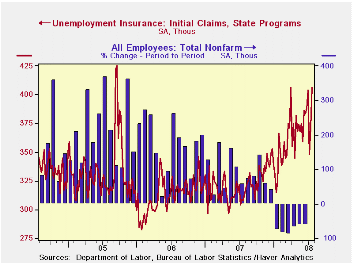
Initial claims for unemployment insurance shot higher last week to 406,000. The latest level compared to an upwardly revised 372,000 during the prior week. It reached a level not seen since this past March which was the highest point since mid-2005. The latest weekly surge surpassed Consensus expectations for a rise to 380,000 claims.
As a result of the latest weekly jump in initial claims the
four-week moving average increased, but just modestly, to 382,500
(23.1% y/y). During June claims averaged 391,000.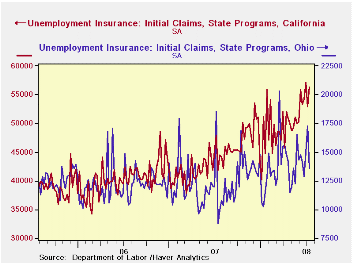
A claims level below 400,000 typically has been associated with growth in nonfarm payrolls. During the last ten years there has been a (negative) 76% correlation between the level of initial claims and the m/m change in nonfarm payroll employment. Over the longer period of time, the level of claims for jobless insurance has not trended higher with the size of the labor force due to a higher proportion of self-employed workers who are not eligible for benefits.
Initial claims claims for jobless insurance in California are
up 34.7% y/y. They also are up 46.0% in New York and by 55.1% in Ohio.
In Massachusetts the gain in claims moderated to 10.7% and in Michigan
the rise fell to 8.2% after the doubling this past May. In Pennsylvania
claims fell 12.1% from last year. 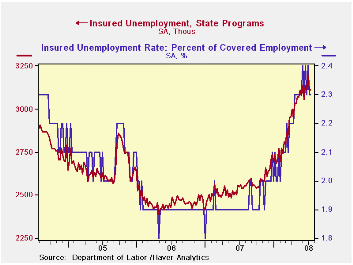
Continuing claims for unemployment insurance during the latest week fell by 9,000 following a little-revised 87,000 worker decline during the prior week. The four-week moving average of continuing claims slipped slightly but remained near the cycle high of 3,142,750. That was roughly a quarter higher than a year ago and the highest level since early 2004.
Continuing claims provide some indication of workers' ability to find employment and they lag the initial claims figures by one week.
The insured rate of unemployment was unchanged at 2.3%.
The Congressional Budget Office's Cost Estimate of the Foreclosure Prevention Act of 2008 can be found here.
| Unemployment Insurance (000s) | 07/19/08 | 07/12/08 | Y/Y | 2007 | 2006 | 2005 |
|---|---|---|---|---|---|---|
| Initial Claims | 406 | 372 | 31.8% | 322 | 313 | 331 |
| Continuing Claims | -- | 3,107 | 22.2% | 2,552 | 2,459 | 2,662 |
by Tom Moeller July 24, 2008
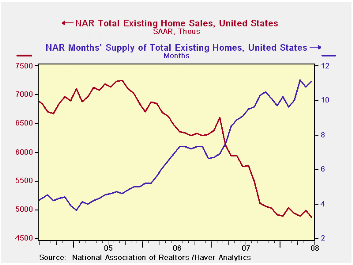
For June the level of existing homes fell 2.6% to 4.86 million, reported the National Association of Realtors. The decline reversed all of a 2.0% increase during May and it was to a new low for this cycle. The figure was weaker than the expected selling rate of 4.94M homes. Total sales include sales of condos and co-ops.
Sales of existing single-family homes fell a larger 3.2%.
These sales (which have a longer history than the total) were at the
lowest level since early-1998.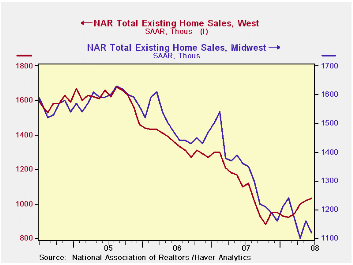
By region, home sales in the West rose for the fourth straight month and they were up 17.0% from the October '07 low. Elsewhere, sales in the Northeast reversed the increases of the prior four months. In the Midwest total sales fell to near the low for this cycle but sales of single-family homes were at the lowest level since 1997. Sales down South fell to the lowest level since 2000.
Median home prices repeated their May
increase and rose 3.5%. Prices were up 10.0% from the February low
after a 33% three-month rate of decline in October. However, prices
typically firm in the Spring.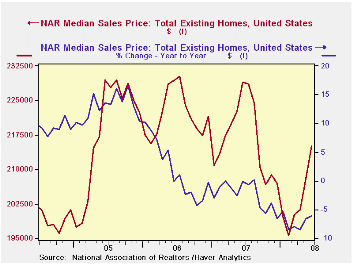
The number of unsold homes (condos & single-family) on the market was roughly unchanged m/m (+2.8% y/y). At the current sales rate the inventory rose slightly to an 11.1 months supply which is about the record high for this series. For single-family homes there also was an 11.0 months supply at the current sales rate which was the highest supply since 1985.
The Fed's latest Beige Book which covers regional economic conditions can be found here.
| Existing
Single Family Home Sales (Thous) |
June | y/y % | May | June '07 | 2007 | 2006 | 2005 |
|---|---|---|---|---|---|---|---|
| Total | 4,860 | -15.5 | 4,990 | 5,750 | 5,672 | 6,508 | 7,076 |
| Northeast | 850 | -15.8 | 910 | 1,010 | 1,008 | 1,090 | 1,168 |
| Midwest | 1,120 | -17.6 | 1,160 | 1,360 | 1,331 | 1,491 | 1,589 |
| South | 1,850 | -18.1 | 1,910 | 2,260 | 2,240 | 2,576 | 2,704 |
| West | 1,030 | -6.4 | 1,020 | 1,100 | 1,093 | 1,353 | 1,617 |
| Single-Family | 4,270 | -14.8 | 4,410 | 5,010 | 4,958 | 5,703 | 6,181 |
| Median Price, Total, $ | 215,100 | -6.1 | 207,900 | 229,000 | 216,617 | 222,000 | 218,217 |
by Robert Brusca July 24, 2008
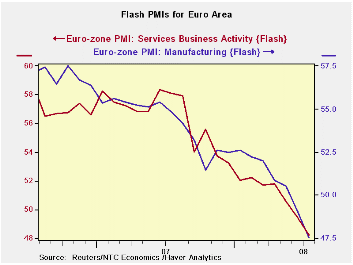
There is little let up in the pace of the drop in the Euro
Area MFG and services PMIs. Indeed their rate of decline has picked up
pace. The services PMI has been in existence for 31 months and it is at
its lowest level since its inception. The MFG is at its lowest level
for that period as well.
The MFG index has been in existence much longer. And for that
longer period back to 1996 it stands in the 26th percentile of its
range - a low reading.
Except for January of this year when the services index fell
very sharply, the past two months represent the fastest six month rate
of decline for the services index. For MFG the July decline is the
fastest six month decline in this cycle. This suggests that the
downward pressure on the Euro Area economies is becoming more intense.
| FLASH Readings | ||
|---|---|---|
| Markit PMIs for the Euro-Area-13 | ||
| MFG | Services | |
| Jul-08 | 47.54 | 48.26 |
| Jun-08 | 49.07 | 49.46 |
| May-08 | 50.52 | 50.59 |
| Apr-08 | 50.85 | 51.78 |
| Averages | ||
| 3-Mo | 49.04 | 49.44 |
| 6-Mo | 50.37 | 50.67 |
| 12-Mo | 51.56 | 52.54 |
| 31-Mo Range | ||
| High | 57.61 | 61.21 |
| Low | 47.54 | 48.26 |
| % Range | 0.0% | 0.0% |
Tom Moeller
AuthorMore in Author Profile »Prior to joining Haver Analytics in 2000, Mr. Moeller worked as the Economist at Chancellor Capital Management from 1985 to 1999. There, he developed comprehensive economic forecasts and interpreted economic data for equity and fixed income portfolio managers. Also at Chancellor, Mr. Moeller worked as an equity analyst and was responsible for researching and rating companies in the economically sensitive automobile and housing industries for investment in Chancellor’s equity portfolio. Prior to joining Chancellor, Mr. Moeller was an Economist at Citibank from 1979 to 1984. He also analyzed pricing behavior in the metals industry for the Council on Wage and Price Stability in Washington, D.C. In 1999, Mr. Moeller received the award for most accurate forecast from the Forecasters' Club of New York. From 1990 to 1992 he was President of the New York Association for Business Economists. Mr. Moeller earned an M.B.A. in Finance from Fordham University, where he graduated in 1987. He holds a Bachelor of Arts in Economics from George Washington University.
More Economy in Brief
 Global| Feb 05 2026
Charts of the Week: Balanced Policy, Resilient Data and AI Narratives
by:Andrew Cates


