 Global| Jul 03 2019
U.S. ISM Nonmanufacturing Index Slips; Prices Rebound
Summary
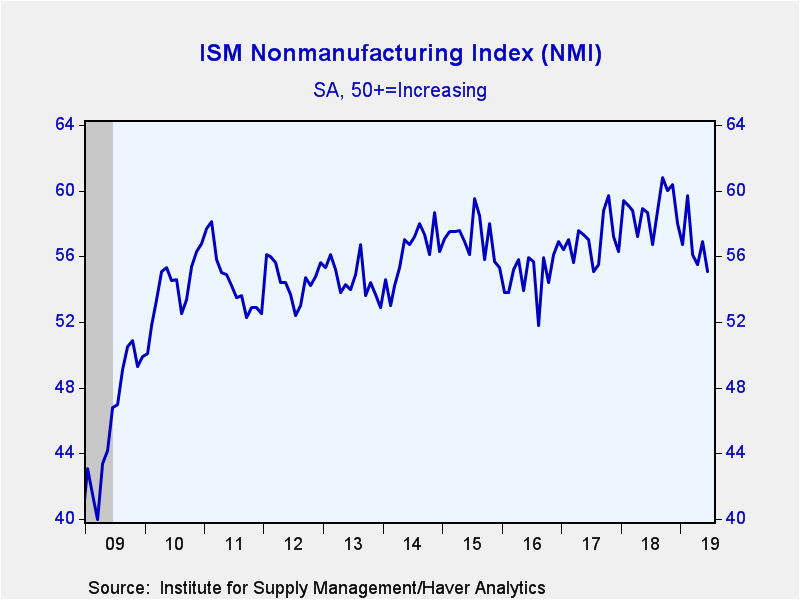
The Composite Index of Nonmanufacturing Sector Activity from the Institute for Supply Management (ISM) dipped to 55.1 in June after rising to 56.9 in May. The Action Economics Forecast Survey had expected a slight deterioration to [...]
The Composite Index of Nonmanufacturing Sector Activity from the Institute for Supply Management (ISM) dipped to 55.1 in June after rising to 56.9 in May. The Action Economics Forecast Survey had expected a slight deterioration to 56.0. Today’s reading was the lowest in nearly two years and more than five points below the cycle high of 60.8 during September of last year. Nevertheless, nonmanufacturing ISM readings in the 55 range are still considered healthy.
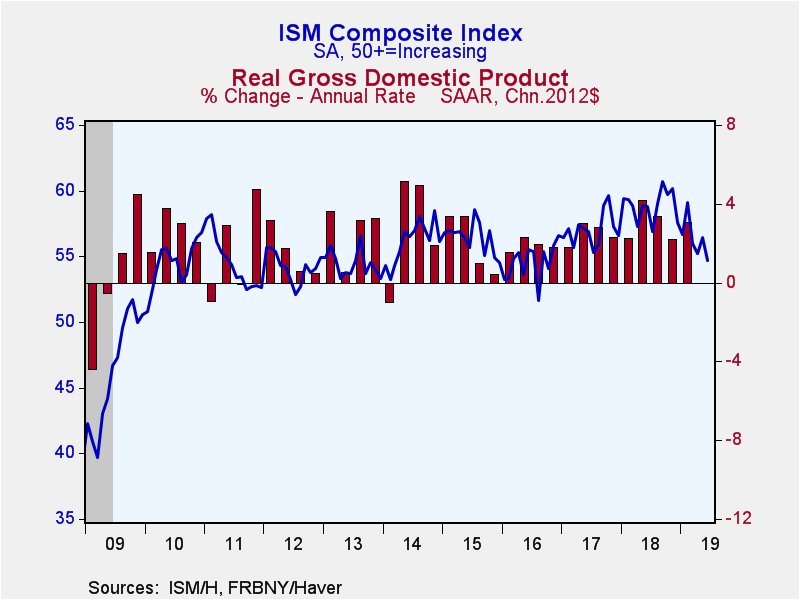
Haver Analytics constructs a composite index combining the nonmanufacturing ISM index and the manufacturing ISM measure, which was released on Monday. This composite index dipped to 54.7 from 56.4 in May. That was the lowest composite index reading since October 2016.
Movement among the component series was mixed last month. The business activity measure declined to 58.2, its lowest level in three months, but remained broadly in line with its trend since 2016. The employment measure fell to 55.0, which was also near its trend. The new orders index fell to 55.8, the lowest reading since December 2017. Partially offsetting these declines was a rebound in the supplier delivery series to 51.5, up from a three-year low of 49.5.
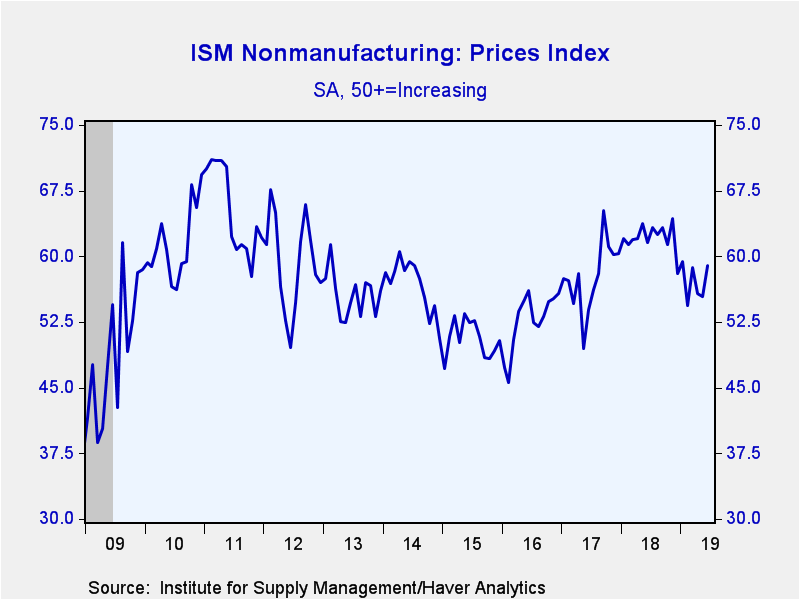
The prices index picked up to 58.9, despite a decline in energy prices during the month. Twenty-seven percent of respondents reported higher prices, up from 21% the month before, while eight percent reported price declines.
Other important sub-series, which are NSA and not included in the overall index, posted healthy readings in the month. The backlog of orders index rebounded to 56.0 from 52.5 in May. The inventory change index increased for the third consecutive month to 55.0.
The ISM figures are available in Haver's USECON database, with additional detail in the SURVEYS database. The expectations figure from Action Economics is in the AS1REPNA database.
| ISM Nonmanufacturing Survey (SA) | Jun | May | Apr | Jun'18 | 2018 | 2017 | 2016 |
|---|---|---|---|---|---|---|---|
| Composite Diffusion Index | 55.1 | 56.9 | 55.5 | 58.7 | 58.9 | 57.0 | 54.9 |
| Business Activity | 58.2 | 61.2 | 59.5 | 62.8 | 61.5 | 60.2 | 58.0 |
| New Orders | 55.8 | 58.6 | 58.1 | 62.0 | 61.3 | 59.3 | 57.6 |
| Employment | 55.0 | 58.1 | 53.7 | 54.4 | 56.9 | 55.1 | 52.5 |
| Supplier Deliveries (NSA) | 51.5 | 49.5 | 50.5 | 55.5 | 55.8 | 53.2 | 51.5 |
| Prices Index | 58.9 | 55.4 | 55.7 | 61.6 | 62.1 | 57.6 | 52.6 |
Peter D'Antonio
AuthorMore in Author Profile »Peter started working for Haver Analytics in 2016. He worked for nearly 30 years as an Economist on Wall Street, most recently as the Head of US Economic Forecasting at Citigroup, where he advised the trading and sales businesses in the Capital Markets. He built an extensive Excel system, which he used to forecast all major high-frequency statistics and a longer-term macroeconomic outlook. Peter also advised key clients, including hedge funds, pension funds, asset managers, Fortune 500 corporations, governments, and central banks, on US economic developments and markets. He wrote over 1,000 articles for Citigroup publications. In recent years, Peter shifted his career focus to teaching. He teaches Economics and Business at the Molloy College School of Business in Rockville Centre, NY. He developed Molloy’s Economics Major and Minor and created many of the courses. Peter has written numerous peer-reviewed journal articles that focus on the accuracy and interpretation of economic data. He has also taught at the NYU Stern School of Business. Peter was awarded the New York Forecasters Club Forecast Prize for most accurate economic forecast in 2007, 2018, and 2020. Peter D’Antonio earned his BA in Economics from Princeton University and his MA and PhD from the University of Pennsylvania, where he specialized in Macroeconomics and Finance.
More Economy in Brief
 Global| Feb 05 2026
Charts of the Week: Balanced Policy, Resilient Data and AI Narratives
by:Andrew Cates


