 Global| Sep 06 2016
U.S. ISM Nonmanufacturing Index Slows
Summary
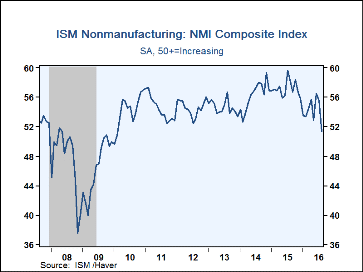
The Composite Index of Nonmanufacturing Sector Business Activity from the Institute for Supply Management (ISM) decreased to 51.4 in August from 55.5 in July. Expectations in the Action Economics Forecast Survey had been for a much [...]
The Composite Index of Nonmanufacturing Sector Business Activity from the Institute for Supply Management (ISM) decreased to 51.4 in August from 55.5 in July. Expectations in the Action Economics Forecast Survey had been for a much more modest slowing to 55.5. The ISM data are diffusion indexes where readings above 50 indicate expansion.
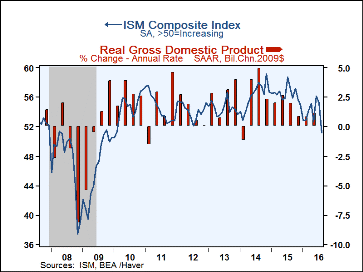
Haver Analytics constructs a Composite Index using the nonmanufacturing ISM index and the ISM factory sector measure that was released September 1st. This Composite declined from 55.2 to 51.2, which is the lowest reading since January 2010. During the last ten years, there has been a 73% correlation between this index and the q/q change in real GDP.
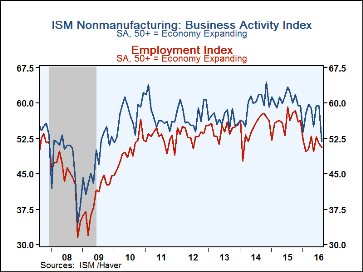
Several of the nonmanufacturing components slowed noticeably. The business activity index retreated to 51.8 in August from 59.3 in July. New orders similarly declined, down to 51.4 in August after 60.3 in July. And employment eased to 50.7 from 51.4. During the last ten years, there has been a 96% correlation between the employment index and the m/m change in service plus construction payrolls. In contrast, the supplier deliveries index firmed slightly, moving from 51.0 in July to 51.5 in August.
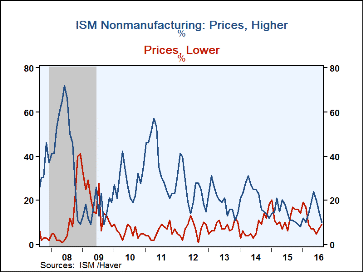
The prices paid series was little changed at 51.8 last month versus 51.9 in July. Ten percent (NSA) of respondents paid higher prices while 9 percent paid lower prices.
The export order series dropped markedly to 46.5 from 55.5. The imports series was 50.5, down from 53.0. The order backlog measure retreated from 51.0 to 49.5, as 12% of respondents had larger backlogs, but 13% saw backlogs shrink. Each of these last few readings is not seasonally adjusted
The figures are available in Haver's USECON database. The expectations figure from Action Economics is in the AS1REPNA database.
| ISM Nonmanufacturing Survey (SA) | Aug | Jul | Jun | Aug'15 | 2015 | 2014 | 2013 |
|---|---|---|---|---|---|---|---|
| Composite Diffusion Index | 51.4 | 55.5 | 56.5 | 58.3 | 57.1 | 56.2 | 54.6 |
| Business Activity | 51.8 | 59.3 | 59.5 | 62.3 | 60.8 | 59.7 | 56.6 |
| New Orders | 51.4 | 60.3 | 59.9 | 62.1 | 59.2 | 58.6 | 55.8 |
| Employment | 50.7 | 51.4 | 52.7 | 56.2 | 56.1 | 54.9 | 54.3 |
| Supplier Deliveries (NSA) | 51.5 | 51.0 | 54.0 | 52.5 | 52.5 | 51.8 | 51.7 |
| Prices Index | 51.8 | 51.9 | 55.5 | 50.5 | 50.7 | 56.8 | 55.7 |
Carol Stone, CBE
AuthorMore in Author Profile »Carol Stone, CBE came to Haver Analytics in 2003 following more than 35 years as a financial market economist at major Wall Street financial institutions, most especially Merrill Lynch and Nomura Securities. She had broad experience in analysis and forecasting of flow-of-funds accounts, the federal budget and Federal Reserve operations. At Nomura Securities, among other duties, she developed various indicator forecasting tools and edited a daily global publication produced in London and New York for readers in Tokyo. At Haver Analytics, Carol was a member of the Research Department, aiding database managers with research and documentation efforts, as well as posting commentary on select economic reports. In addition, she conducted Ways-of-the-World, a blog on economic issues for an Episcopal-Church-affiliated website, The Geranium Farm. During her career, Carol served as an officer of the Money Marketeers and the Downtown Economists Club. She had a PhD from NYU's Stern School of Business. She lived in Brooklyn, New York, and had a weekend home on Long Island.


