 Global| Apr 16 2020
U.S. Jobless Claims Still Very Large, but Do Fall by 1.37 Million in April 11 Week
Summary
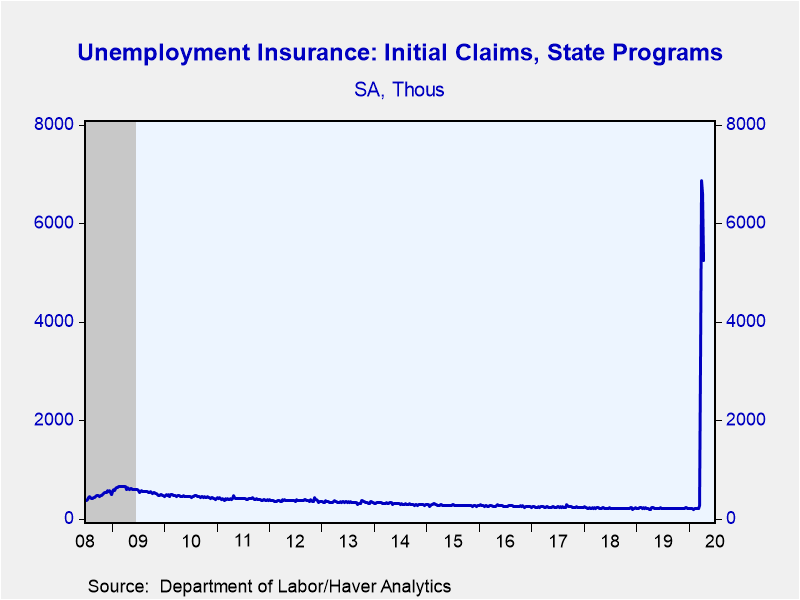
• Initial jobless claims decline to 5.245 million in the week ending April 11. • Over the last four weeks 22.4 million people have filed new claims. • Thirty-nine states had decreases, but all remain at historic amounts Initial [...]
• Initial jobless claims decline to 5.245 million in the week ending April 11.
• Over the last four weeks 22.4 million people have filed new claims.
• Thirty-nine states had decreases, but all remain at historic amounts
Initial jobless claims for unemployment insurance eased 1.370 million to 5.245 million (2,485% year-on-year) during the week ending April 11. The previous week was revised up marginally from 6.606 million to 6.615 million. During the last four weeks 22.034 million people or 13.5% of the labor force have filed new claims. The Action Economics Forecast Survey anticipated 4.0 million new claims.
The four-week moving average of initial claims was 5.508 million. This measure now reflects the period of major labor market disruption due to the coronavirus, so it makes a meaningful comparison to the 232,500 of the week ended March 14, just before the bulk of business closures and contractions began.
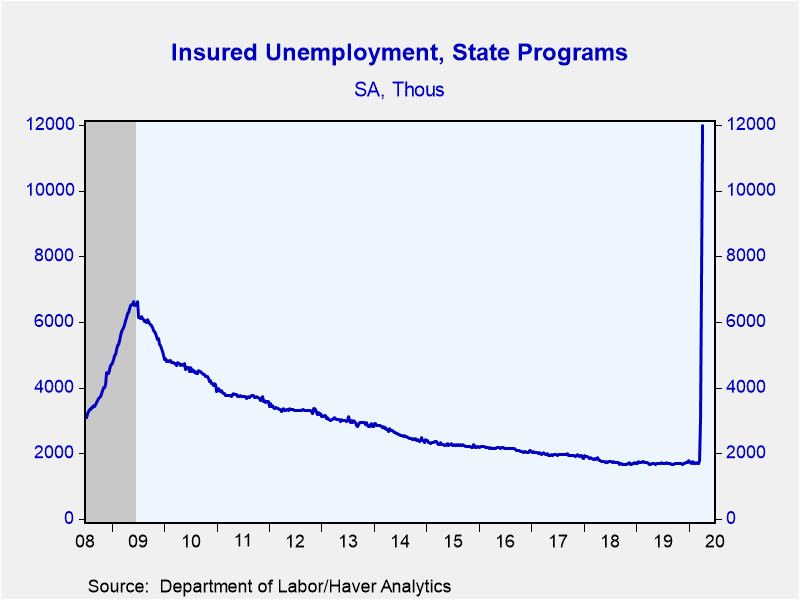
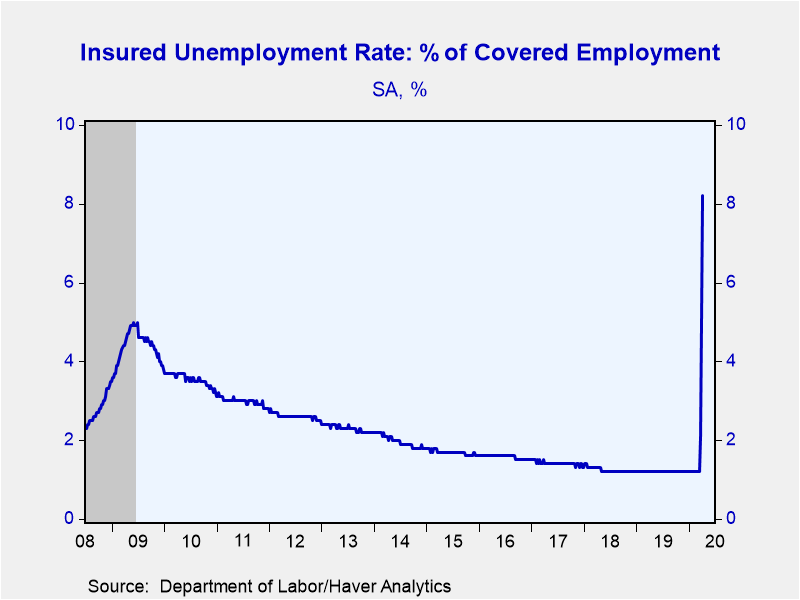
Continuing claims for unemployment insurance increased 4.530 million to a record 11.976 million (618.4% y/y) in the week ending April 4, from 7.446 million; the earlier number was revised marginally from 7.455 million. The four-week moving average of claimants increased to 6.066 million from 3.498 million. The insured rate of unemployment rose from 5.1% to 8.2%, a new high. The prior record was 7.0% in the week of May 31, 1975.
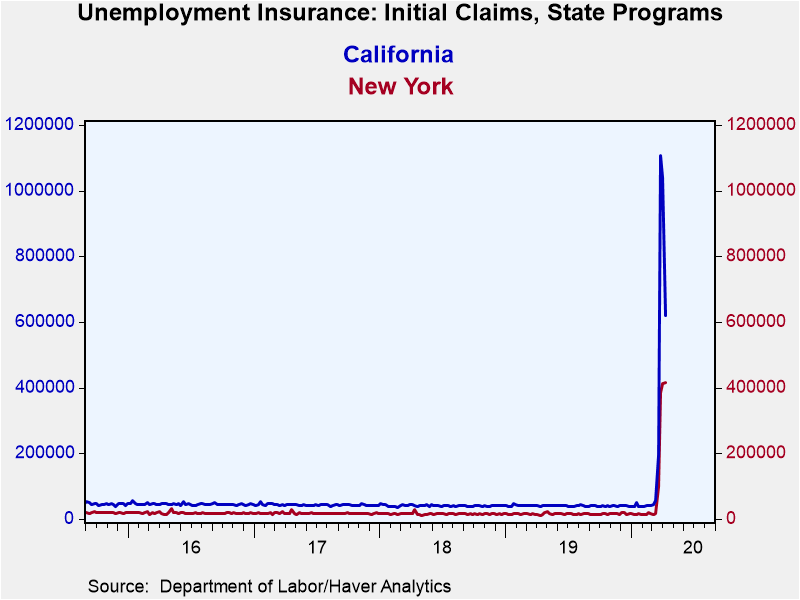
The drop in initial claims this past week was spread across 39 states, although all of these still had enormous numbers, far ahead of their usual history. All of these state data are seasonally adjusted by Haver Analytics and include the “advance” data for the latest week. The biggest decrease was in California, which still had the largest number of claims overall, 618,708, but that compares to 1,041,031 in the April 4 week. Michigan had the next biggest drop, 167,096, but still experienced 292,895 claims, its third highest number ever. Initial claims in New York State still went up, along with those in ten other states; New York had 416,701, up 4,432 on the week. The biggest increase was actually in Colorado, which saw 100,241 claims, up 57,059 the prior week’s 43,182, that is, more than double. The history of these state data does vary; most extend back to January 1987, but some, such as Indiana, go back to January 1977 or various other years.
The state insured rates of unemployment are lagged by two weeks; the new data cover the week ended March 28. The highest rate was in Rhode Island at 11.85%, followed by Pennsylvania at 9.77%. The lowest rate was in Florida at 1.15%, with South Dakota next at 1.81%. California saw 6.24% and New York 7.60%. Most states have record rates, but some such as Kansas and Missouri saw their highs during the Great Recession in 2008-09 (These data are not seasonally adjusted).
Data on weekly unemployment claims going back to 1967 are contained in Haver's WEEKLY database, and they are summarized monthly in USECON. Data for individual states are in REGIONW. The expectations figure is from the Action Economics Forecast Survey, carried in the AS1REPNA database.
| Unemployment Insurance (SA, 000s) | 04/11/20 | 04/04/20 | 03/28/20 | Y/Y % | 2019 | 2018 | 2017 |
|---|---|---|---|---|---|---|---|
| Initial Claims | 5,245 | 6,615 | 6,867 | 2,483.74 | 218 | 221 | 244 |
| 4-wk avg | 5,508.50 | 4,267.75 | 2,666.75 | -- | -- | -- | -- |
| Continuing Claims | -- | 11,976 | 7,446 | 618.42 | 1,701 | 1,756 | 1,961 |
| 4-wk avg | -- | 6,066.25 | 3,497.75 | -- | -- | -- | -- |
| Insured Unemployment Rate (%) | -- | 8.2 | 5.1 |
1.2 |
1.2 | 1.2 | 1.4 |
Carol Stone, CBE
AuthorMore in Author Profile »Carol Stone, CBE came to Haver Analytics in 2003 following more than 35 years as a financial market economist at major Wall Street financial institutions, most especially Merrill Lynch and Nomura Securities. She has broad experience in analysis and forecasting of flow-of-funds accounts, the federal budget and Federal Reserve operations. At Nomura Securites, among other duties, she developed various indicator forecasting tools and edited a daily global publication produced in London and New York for readers in Tokyo. At Haver Analytics, Carol is a member of the Research Department, aiding database managers with research and documentation efforts, as well as posting commentary on select economic reports. In addition, she conducts Ways-of-the-World, a blog on economic issues for an Episcopal-Church-affiliated website, The Geranium Farm. During her career, Carol served as an officer of the Money Marketeers and the Downtown Economists Club. She has a PhD from NYU's Stern School of Business. She lives in Brooklyn, New York, and has a weekend home on Long Island.


