 Global| Oct 11 2017
U.S. JOLTS: Job Openings Rate Holds Steady & Strong; Hiring Dips
by:Tom Moeller
|in:Economy in Brief
Summary
The Bureau of Labor Statistics reported that the total job openings rate in August remained at the record high of 4.0% for the third straight month. Figures prior to August were unrevised. The hiring rate slipped from its expansion [...]
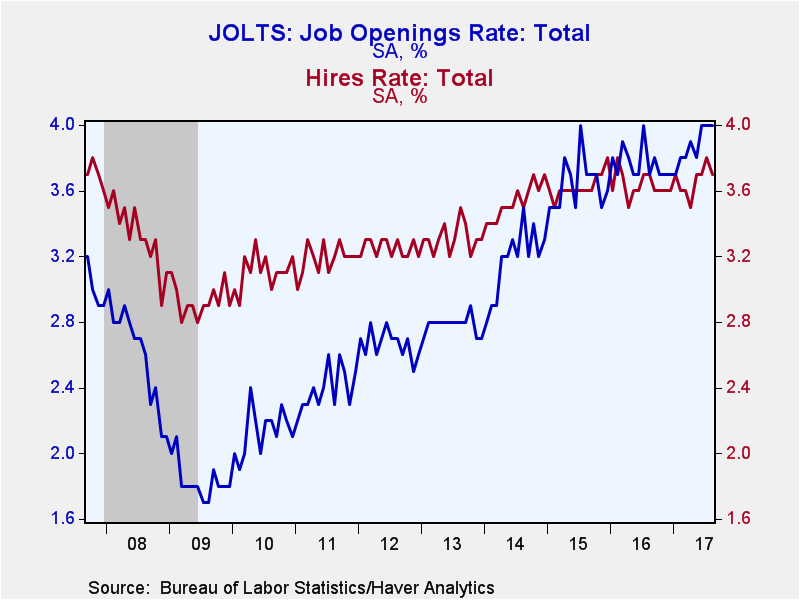
The Bureau of Labor Statistics reported that the total job openings rate in August remained at the record high of 4.0% for the third straight month. Figures prior to August were unrevised. The hiring rate slipped from its expansion high of 3.8% to 3.7%. These figures are from the Job Openings & Labor Turnover Survey (JOLTS) and date back to December 2000.
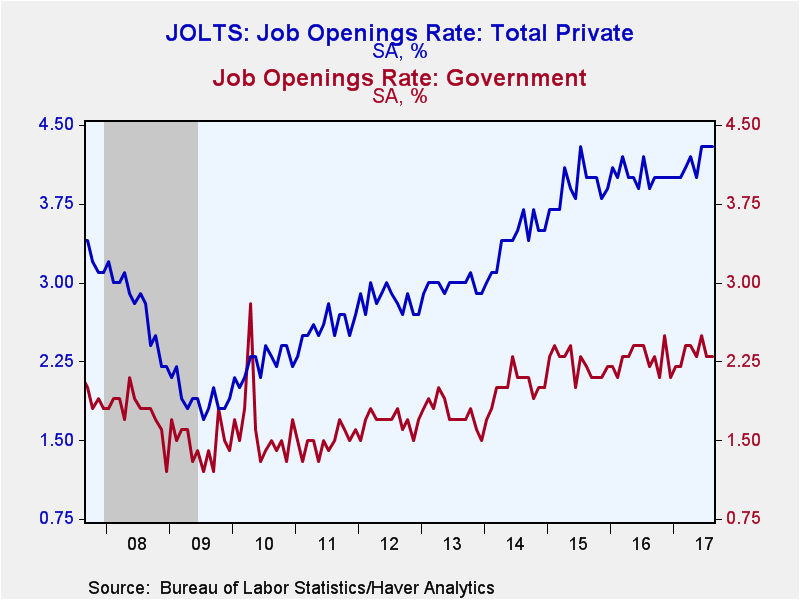
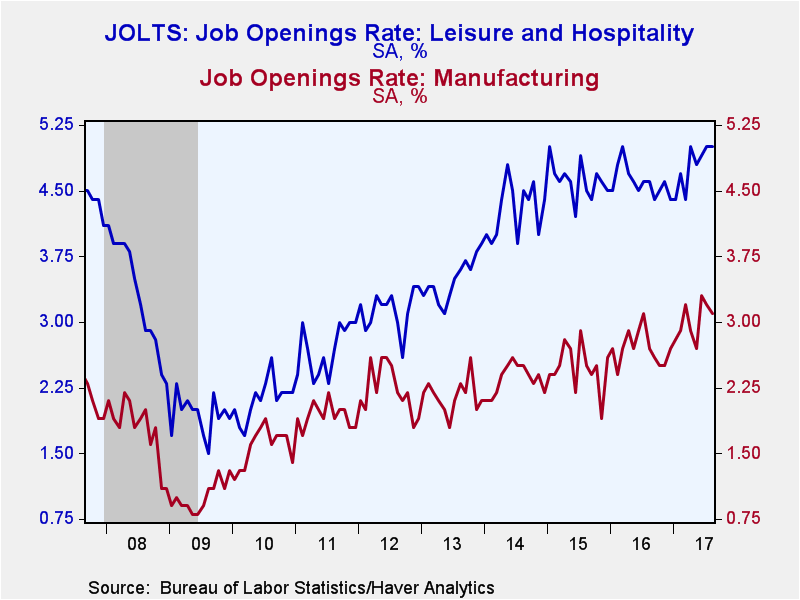
The private-sector job openings rate held steady at a record 4.4%. The job openings rate in the leisure & hospitality sector remained strong at 5.1% which was just below the 2001 high. The trade, transportation & utilities rate remained at 3.8%, but retail trade improved slightly to 3.9%, just below the record high of 4.0%. The professional and business services openings rate eased m/m to 4.9% and remained well below its 6.1% high in March of last year. The education & health services rate increased to 4.9%, up y/y from 4.4%. The construction sector job openings rate surged to 3.5%, the highest level since February 2007 and up from 1.3% in November 2015. The factory sector job openings rate eased to 3.1% from June's record high of 3.3%. The government sector rate held at 2.3%, down from June's seven-year high of 2.5%. The job openings rate is the number of job openings on the last business day of the month as a percent of total employment plus job openings.
The actual number of job openings decreased 0.9% from its record to 6.082 million in July. It remained up 10.8% y/y. Private-sector job openings declined 1.0% (+11.7% y/y), just below July's record of 5.625 million, led by a 4.1% drop (+17.1% y/y) in the factory sector. Professional & business services job openings eased 0.9% (+4.1% y/y) while leisure & hospitality sector saw 0.2% fewer (+11.6% y/y) openings. Job openings in the construction sector increased 4.2% to the highest level since February 2007, up one-third y/y. Trade, transportation and utilities job openings rose 2.0% (0.9% y/y), including a 4.7% rise (5.4% y/y) in the retail sector. Education & health services openings increased 1.7% (12.9% y/y). Job postings in the public sector ticked 0.2% higher (+1.0% y/y).
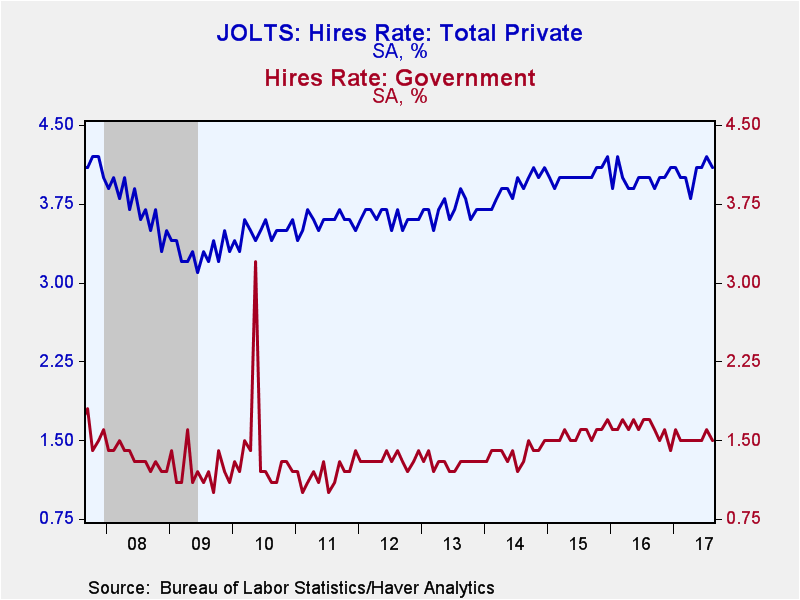
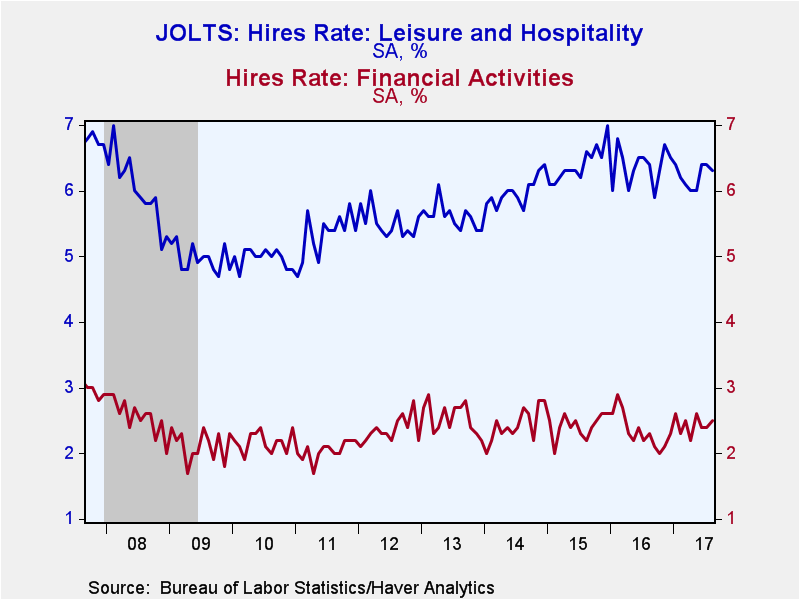
The dip in the overall hires rate reflected a decline in the private sector rate to 4.1%. That still was near the highest level since February 2016. The hiring rate in leisure & hospitality slipped m/m to 6.3%, down versus the 6.8% high early last year. The hiring rate in professional & business services eased to 5.5%. The construction sector hiring rate jumped to 5.6%, a seven month high, while the hires rate in the education & health services sector eased to 2.8%. The trade, transportation & utilities rate held steady m/m at 3.7%, but remained in this year's down trend. The manufacturing hires rate remained at its ten-year high of 2.7%. The government sector hiring rate eased to 1.5%, down from 1.7% one year earlier.
The total number of hires declined 1.6% (+2.7% y/y) and backed away from the eleven-year high of 5.521 million. The number of private-sector hires declined 1.4% (+4.0% y/y) and fell just below the expansion high of 5.175 million. Construction sector hiring jumped 9.3% (14.2% y/y), but factory sector hiring eased 0.3% (+31.3% y/y). Hiring in education & health services declined 2.4% (+1.4% y/y). Professional & business service sector hiring dropped 5.4% (+2.9% y/y) and backed away from the record 1.200 million. Hiring in trade, transportation & utilities eased 0.4% (-6.4% y/y) and was 12.2% below its high in February 2016. The number of leisure & hospitality jobs eased 0.6% (+1.5% y/y). Government sector employment declined 6.1% (-14.0% y/y).
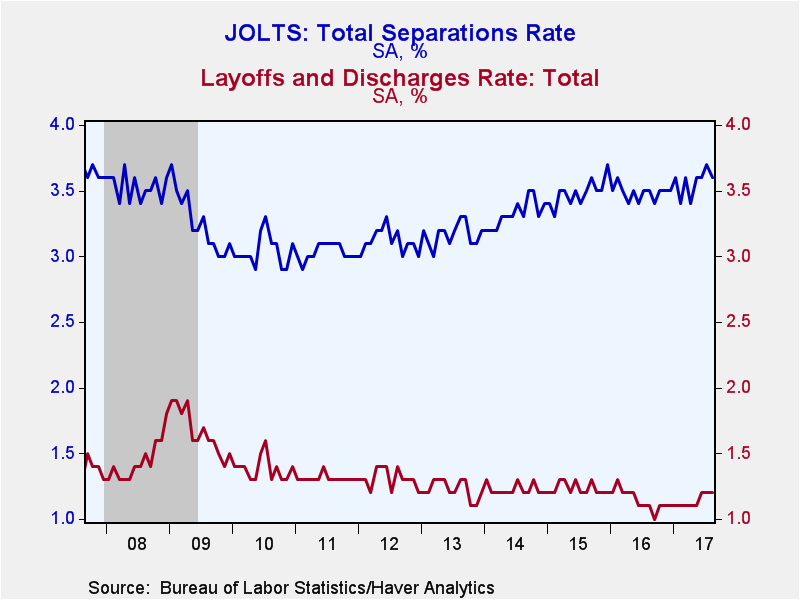
The total job separations rate eased to 3.6%. The leisure & hospitality separations rate jumped to 6.2%, though that was down from last year's 6.6% high. The construction sector's separations rate fell to 5.1%. The professional and business services rate fell to 5.1%. In trade, transportation & utilities, the separations rate eased to 3.6%. The information sector's rate backpedaled to 2.9%. The factory sector separations rate eased to 2.4%, while the separations rate in the financial sector rose to 2.5%. The separations rate in the government sector eased to 1.5%. Separations include quits, layoffs, discharges, and other separations as well as retirements.
The layoff and discharge rate held at 1.2%, the highest level since May of last year. That was higher than the 1.0% low in September of last year. The private-sector rate held at 1.3% and remained below the 2015 high of 1.5%. The government sector rate at 0.5% remained near the recovery low. Total layoffs increased 4.2% y/y. Private-sector layoffs increased 5.8% y/y, while government layoffs declined 15.6% y/y.
Large numbers of hires and separations occur every month throughout the business cycle. Net employment change results from the relationship between hires and separations. When the number of hires exceeds the number of separations, employment rises, even if the hires level is steady or declining. Conversely, when the number of hires is less than the number of separations, employment declines, even if the hires level is steady or rising. These totals include workers who may have been hired and separated more than once during the year.
The JOLTS survey dates to December 2000 and the figures are available in Haver's USECON database.
| JOLTS (Job Openings & Labor Turnover Survey, SA) | Aug | Jul | Jun | Aug '16 | 2016 | 2015 | 2014 |
|---|---|---|---|---|---|---|---|
| Job Openings, Total | |||||||
| Rate (%) | 4.0 | 4.0 | 4.0 | 3.7 | 3.7 | 3.6 | 3.3 |
| Total (000s) | 6,082 | 6,140 | 6,116 | 10.8% | 3.1% | 12.1% | 28.1% |
| Hires, Total | |||||||
| Rate (%) | 3.7 | 3.8 | 3.7 | 3.7 | 43.6 | 43.5 | 42.4 |
| Total (000s) | 5,430 | 5,521 | 5,432 | 2.7% | 1.2% | 5.8% | 8.2% |
| Layoffs & Discharges, Total | |||||||
| Rate (%) | 1.2 | 1.2 | 1.2 | 1.1 | 13.7 | 14.8 | 14.7 |
| Total (000s) | 1,729 | 1,789` | 1,806 | 4.2% | -4.8% | 2.8% | 2.3% |
Tom Moeller
AuthorMore in Author Profile »Prior to joining Haver Analytics in 2000, Mr. Moeller worked as the Economist at Chancellor Capital Management from 1985 to 1999. There, he developed comprehensive economic forecasts and interpreted economic data for equity and fixed income portfolio managers. Also at Chancellor, Mr. Moeller worked as an equity analyst and was responsible for researching and rating companies in the economically sensitive automobile and housing industries for investment in Chancellor’s equity portfolio. Prior to joining Chancellor, Mr. Moeller was an Economist at Citibank from 1979 to 1984. He also analyzed pricing behavior in the metals industry for the Council on Wage and Price Stability in Washington, D.C. In 1999, Mr. Moeller received the award for most accurate forecast from the Forecasters' Club of New York. From 1990 to 1992 he was President of the New York Association for Business Economists. Mr. Moeller earned an M.B.A. in Finance from Fordham University, where he graduated in 1987. He holds a Bachelor of Arts in Economics from George Washington University.


