 Global| Aug 20 2015
U.S. Leading Economic Index Declines in July
Summary
The Conference Board's Leading Economic Index fell 0.2% in July after June's 0.6% increase; the latter was unrevised from the initial report. The Action Economics Forecast Survey had foreseen a 0.2% rise. July's reversal put the [...]
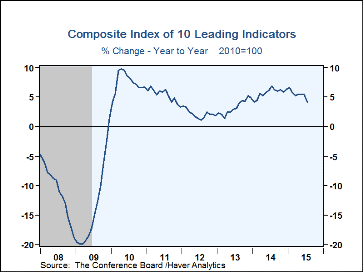
The Conference Board's Leading Economic Index fell 0.2% in July after June's 0.6% increase; the latter was unrevised from the initial report. The Action Economics Forecast Survey had foreseen a 0.2% rise. July's reversal put the three-month growth rate at 3.6% (AR), down from 7.1% in June. The total decline was due to just two components, building permits and stock prices. Permits, in particular, subtracted 0.54% from the total. The workweek in manufacturing was steady, and the other seven items were all positive. The largest contributions came from the steepness of the yield curve, the fall in jobless claims and continuing firmness in the leading credit index.
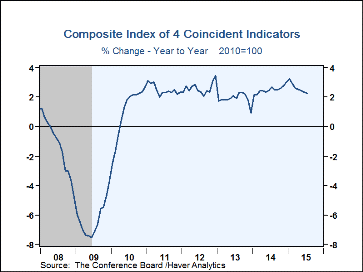
The coincident economic index was up 0.2% in July, the same as in June, which was unrevised. The three-month growth rate was 1.8% (AR) while June's pace was revised to 1.8% from 2.8%. All four component series increased in July, especially nonfarm payroll employment and industrial production, with smaller contributions from personal income less transfers and manufacturing & trade sales.
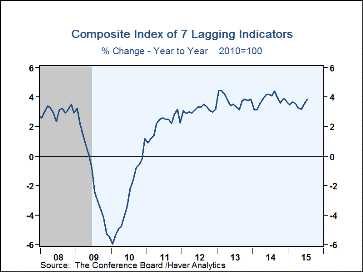
The lagging indicators index rose 0.3%, following June's 0.7%, which was also unrevised. The three-month growth rate here picked up to 5.2% (AR) from 4.2% in June. Four of the components made positive contributions in July, one was flat and two others were negative. Commercial & industrial loans at banks made the biggest positive contribution, while the average duration of unemployment retreated somewhat from its sizable positive move in June.
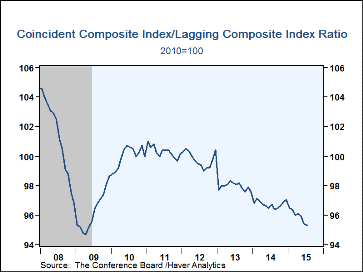
The ratio of coincident-to-lagging indicators is a measure of how the economy is performing versus its excesses. With the increase in the lagging indicators larger in July than that in the coincident ones, this ratio fell further and stood at 95.3, its lowest reading since May 2009, still during the last recession.
The Conference Board figures are available in Haver's BCI database; the components are available there, and most are also in USECON. The forecast figures for the Consensus are in the AS1REPNA database. Visit the Conference Board's site for coverage of leading indicator series from around the world.
| Business Cycle Indicators (%) | Jul | Jun | May | Jul Y/Y | 2014 | 2013 | 2012 |
|---|---|---|---|---|---|---|---|
| Leading | -0.2 | 0.6 | 0.6 | 4.1 | 5.8 | 3.3 | 2.1 |
| Coincident | 0.2 | 0.2 | 0.1 | 2.3 | 2.5 | 1.9 | 2.6 |
| Lagging | 0.3 | 0.7 | 0.3 | 3.9 | 3.8 | 3.8 | 3.1 |
Carol Stone, CBE
AuthorMore in Author Profile »Carol Stone, CBE came to Haver Analytics in 2003 following more than 35 years as a financial market economist at major Wall Street financial institutions, most especially Merrill Lynch and Nomura Securities. She had broad experience in analysis and forecasting of flow-of-funds accounts, the federal budget and Federal Reserve operations. At Nomura Securities, among other duties, she developed various indicator forecasting tools and edited a daily global publication produced in London and New York for readers in Tokyo. At Haver Analytics, Carol was a member of the Research Department, aiding database managers with research and documentation efforts, as well as posting commentary on select economic reports. In addition, she conducted Ways-of-the-World, a blog on economic issues for an Episcopal-Church-affiliated website, The Geranium Farm. During her career, Carol served as an officer of the Money Marketeers and the Downtown Economists Club. She had a PhD from NYU's Stern School of Business. She lived in Brooklyn, New York, and had a weekend home on Long Island.
More Economy in Brief
 Global| Feb 05 2026
Charts of the Week: Balanced Policy, Resilient Data and AI Narratives
by:Andrew Cates


