 Global| Mar 17 2011
U.S. Leading Economic Indicators Improve -- With a Caveat
Summary
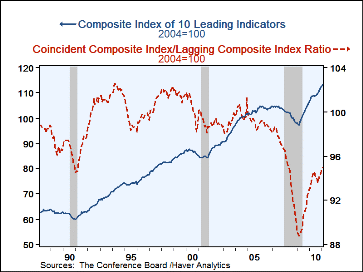
The Conference Board reported that its Index of Leading Economic Indicators rose 0.8% in February, following a slim 0.1% rise in January. The index now stands at 113.4 (2004=100), compared to the recession low 97.4, registered in [...]
 The
Conference Board reported that its Index of Leading Economic Indicators rose 0.8%
in February, following a slim 0.1% rise in January. The index now stands
at 113.4 (2004=100), compared to the recession low 97.4, registered in March
2009, three months before the trough in the overall economy. Consensus
expectations had anticipated a 0.9% increase in the February figure.
These gains put the three-month rate of increase at 7.8% (AR), a fourth consecutive sizable rise after the uptrend in the index had paused last summer and fall. The leading index is based on actual reports for eight economic data series. The Conference Board initially estimates two series, consumer and capital goods orders.
The breadth of increase among the components, measured by the 1-month diffusion index, rose from 55% in January to 80% last month, only the second incidence of that high number in the last 14 months. A steeper yield curve, that is, 10-year Treasuries over federal funds, was the main contributor to the February advance, with the drop in unemployment insurance claims a close second. The two drags on the index are an estimated decrease in capital goods orders and the retreat in building permits. Notably, however, the fragmentary information we have so far on March has turned back negative or neutral: consumer sentiment dropped hard in the preliminary Michigan Survey reading, the yield curve spread and the stock market have decreased slightly, and through the second week, unemployment insurance claims have flattened. These early readings clearly put a note of caution on our view after February's nice rebound in the total index.
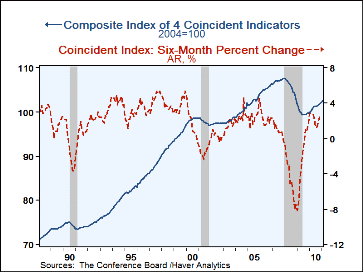
The index of coincident indicators continued to move higher in February, rising 0.2%. The three-month annualized rate of change was 3.2%, the same as January, making these the best two months since last June.
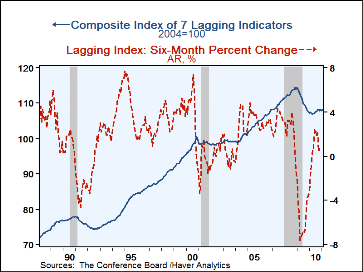
The lagging index rose 0.2% in February, reversing most of January's 0.3% decline. The ratio of coincident-to-lagging indicators, which tends to "lead" the "leaders" was steady at January's 94.9%, a high for the current recovery.
The Conference Board figures are available in Haver's BCI database; the components are available there and most are also in USECON. Visit the Conference Board's site for coverage of leading indicator series from around the world.
| Business Cycle Indicators(%) | Feb | Jan | Dec | Y/Y | 2010 | 2009 | 2008 |
|---|---|---|---|---|---|---|---|
| Leading | 0.8 | 0.1 | 1.0 | 5.8 | 7.8 | 0.3 | -3.1 |
| Coincident | 0.2 | 0.3 | 0.3 | 2.5 | 1.1 | -5.4 | -1.3 |
| Lagging | 0.2 | -0.3 | 0.2 | 0.6 | -2.9 | -1.9 | 3.1 |
Carol Stone, CBE
AuthorMore in Author Profile »Carol Stone, CBE came to Haver Analytics in 2003 following more than 35 years as a financial market economist at major Wall Street financial institutions, most especially Merrill Lynch and Nomura Securities. She has broad experience in analysis and forecasting of flow-of-funds accounts, the federal budget and Federal Reserve operations. At Nomura Securites, among other duties, she developed various indicator forecasting tools and edited a daily global publication produced in London and New York for readers in Tokyo. At Haver Analytics, Carol is a member of the Research Department, aiding database managers with research and documentation efforts, as well as posting commentary on select economic reports. In addition, she conducts Ways-of-the-World, a blog on economic issues for an Episcopal-Church-affiliated website, The Geranium Farm. During her career, Carol served as an officer of the Money Marketeers and the Downtown Economists Club. She has a PhD from NYU's Stern School of Business. She lives in Brooklyn, New York, and has a weekend home on Long Island.


