 Global| Aug 18 2011
U.S. Leading Indicators Are Up in July, But Can It Last?
Summary
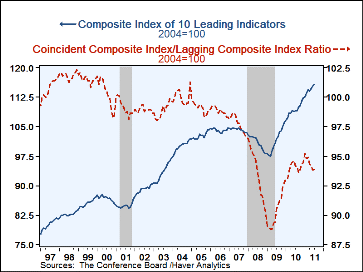
The Conference Board reported that its Leading Economic Indicators index rose 0.5% in July following June's unrevised 0.3% increase. A Consensus forecast looked for a 0.2% rise. The latest three-month growth rate (annualized) picked [...]
 The
Conference Board reported that its Leading Economic Indicators index rose 0.5%
in July following June's unrevised 0.3% increase. A Consensus forecast
looked for a 0.2% rise. The latest three-month growth rate (annualized) picked
up to 6.5% in July from June's 3.2% pace.
The 1-month diffusion index advanced to 65% from 50% in June; the 6-month diffusion index was 70% and over the last year, the 1-month index has averaged 64%. Money supply growth and a steeper yield curve once again made the largest contributions to the July rise, as they had in June. Unemployment insurance claims, stock prices and manufacturers' orders also contributed positively. The negative items were ISM vendor deliveries, Michigan consumer expectations and housing permits.
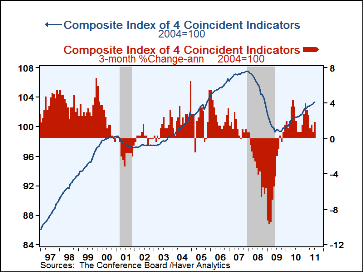
The index of coincident indicators rose 0.3% in July, firmer than June's 0.1% (unrevised) and the strongest since 0.3% in March. The 3-month annualized growth rate was 3.6%, up from 1.2% in June and also the best reading since March. All four of the component series (employment, income, production and sales) contributed to the July gain, led by the 0.9% increase in industrial production.
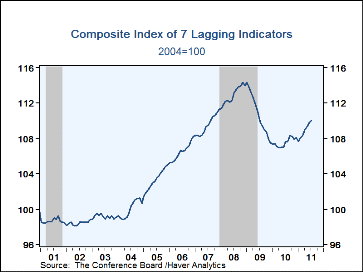
The lagging indicator index rose 0.2% in July, following 0.4% in June, upwardly revised from 0.3% reported before. Growth in bank lending to commercial and industrial customers led once again, followed by an increase in the ratio of consumer credit to personal income. The ratio of coincident-to-lagging indicators, which tends to "lead" the "leaders" edged up to 93.9 from 93.8 in June.
Despite the pretty good showing of the leading index in July, that may turn out to be transitory. The fragmentary items available thus far in August look to be mixed at best. As seen elsewhere today, unemployment insurance claims continue a struggle to stay below 400,000. A boost does appear in money growth, but that may reflect a rush into cash and out of the stock market. The yield curve has flattened markedly over the last couple of weeks as the 10-year note yield dropped, also likely reflecting investors' move to relative safety from a volatile stock market. And the month's first read of the Michigan survey showed a drop in the consumer expectations component of almost 9 points to its lowest level since the winter of 2009. The Philly Fed Business Outlook Survey results suggest that manufacturing items may turn down as well. We can hope not.
The Conference Board figures are available in Haver's BCI database; the components are available there, and most are also in USECON. The forecast figure is the Consensus in the AS1REPNA database. Visit the Conference Board's site for coverage of leading indicator series from around the world.
| Business Cycle Indicators(%) | July | Jun | May | Y/Y | 2010 | 2009 | 2008 |
|---|---|---|---|---|---|---|---|
| Leading | 0.5 | 0.3 | 0.7 | 6.2 | 7.8 | 0.3 | -3.1 |
| Coincident | 0.3 | 0.1 | 0.1 | 2.0 | 1.1 | -5.4 | -1.3 |
| Lagging | 0.2 | 0.4 | 0.4 | 2.2 | -2.9 | -1.9 | 3.1 |
Carol Stone, CBE
AuthorMore in Author Profile »Carol Stone, CBE came to Haver Analytics in 2003 following more than 35 years as a financial market economist at major Wall Street financial institutions, most especially Merrill Lynch and Nomura Securities. She had broad experience in analysis and forecasting of flow-of-funds accounts, the federal budget and Federal Reserve operations. At Nomura Securities, among other duties, she developed various indicator forecasting tools and edited a daily global publication produced in London and New York for readers in Tokyo. At Haver Analytics, Carol was a member of the Research Department, aiding database managers with research and documentation efforts, as well as posting commentary on select economic reports. In addition, she conducted Ways-of-the-World, a blog on economic issues for an Episcopal-Church-affiliated website, The Geranium Farm. During her career, Carol served as an officer of the Money Marketeers and the Downtown Economists Club. She had a PhD from NYU's Stern School of Business. She lived in Brooklyn, New York, and had a weekend home on Long Island.
More Economy in Brief
 Global| Feb 05 2026
Charts of the Week: Balanced Policy, Resilient Data and AI Narratives
by:Andrew Cates


