 Global| Nov 20 2009
U.S. Leading Indicators Continue To Signal Economic Recovery
by:Tom Moeller
|in:Economy in Brief
Summary
The leaders haven't missed one yet in their sixty year history. Therefore, the probability is high that economic recovery is near for the U.S. Released yesterday, the Conference Board's Index of Leading Economic Indicators rose 0.3% [...]
The leaders haven't missed one yet in their sixty year history. Therefore, the probability is high that economic recovery is near for the U.S. Released yesterday, the Conference Board's Index of Leading Economic Indicators rose 0.3% in October. That followed an unrevised 1.0% September increase and was the seventh gain in a row. Moreover, the 10.2% (centered) rate of increase during the last six months was nearly the strongest since early-1983. The leading index is based on actual reports for eight economic data series. The Conference Board initially estimates two series, consumer and capital goods orders.
The breadth of increase amongst the component series sagged a bit last month. Sixty percent of the components rose during October versus last month's reading of 75%. During the most recent six months, however, 80% to 90% of the series rose. Prominent in last month's increase was the steeper interest rate yield curve. The money supply, stock prices, hours worked, jobless insurance claims and orders for consumer goods contributed to the index's rise as well. These gains were offset by lower capital goods orders, lower building permits, quicker vendor performance, and lower consumer expectations.
Continuing to suggest that the rate of decline in the economy
is slowing were the coincident indicators. They were unchanged during
October after a slight September decline. During the last six months
the 1.4% rate of decline in the coincident series compares with a
shortfall of 8.0% at its worst in January. Prompting the moderation
have been slight increases in industrial production, real personal
income and higher business sales as well as fewer declines in payroll
employment.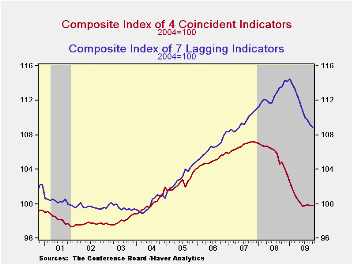
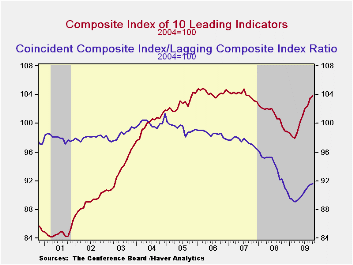
In a continued sign that excesses in the U.S. economy are falling, the lagging index has been down since December of last year. Leading the decline has been lower commercial & industrial loans outstanding as well as less consumer credit. The ratio of coincident-to-lagging indicators (a measure of economic excess) also continued higher for the seventh straight month to the highest level since November.
The Conference Board figures are available in Haver's BCI database. Visit the Conference Board's site for coverage of leading indicator series from around the world.
The Peak Oil Debate from the Federal Reserve Bank of Atlanta can be found here.
| Business Cycle Indicators (%) | October | September | August | July 6-Month % (AR) | 2008 | 2007 | 2006 |
|---|---|---|---|---|---|---|---|
| Leading | 0.3 | 1.0 | 0.4 | 10.2 | -2.8 | -0.3 | 1.5 |
| Coincident | 0.0 | -0.1 | 0.1 | -1.4 | -0.9 | 1.6 | 2.5 |
| Lagging | -0.2 | -0.5 | -0.4 | -6.3 | 2.9 | 2.8 | 3.3 |
Italian and French Industrial Orders Are Up In September
by Robert Brusca November 20, 2009
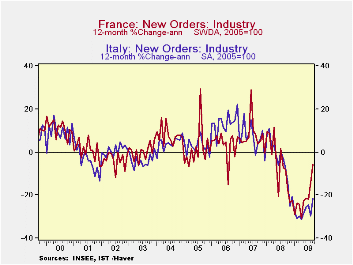
Orders in Italy and in France were up strongly in September
but on different causes. Both posted an orders rise in excess of five
percent on the month. But Italy’s orders were boosted by a 7% gain in
foreign orders; in France foreign orders rose by just 0.3%. Over three
months Italian foreign orders are up at a 25% annual rate while
domestic orders have sunk, dropping at an 18% annual rate. French
foreign orders are very weak over the past two months but an order
spurt in July keeps its three-month growth rate for foreign orders
ahead of its domestic order growth for now. Yr/Yr Italian domestic and
foreign orders are at similar rates of growth with both declining by
about 21%. Over the past year France’s foreign orders are weaker than
total orders as domestic orders have buoyed the economy.
As a result overall French orders are up at an increasing strong pace.
Italian orders are making a slower and less decisive turn higher.
On balance e-Zone countries are showing a turn for the better. Italy is
lagging. But the Zone seems to be making a sustained move to better
growth. France is one of the strongest EMU members and it has a large
rise in its fiscal deficit to show for it.
| Italy Orders | ||||||
|---|---|---|---|---|---|---|
| Saar exept m/m | Sep-09 | Aug-09 | Jul-09 | 3-mo | 6-mo | 12-mo |
| Total | 5.2% | -8.6% | 2.4% | -5.8% | -3.8% | -21.4% |
| Foreign | 7.0% | -12.8% | 13.3% | 25.2% | 9.1% | -21.6% |
| Domestic | 4.2% | -6.2% | -2.8% | -18.5% | -10.1% | -21.3% |
| Memo | ||||||
| Sales | 2.3% | -1.3% | 0.9% | 7.6% | -1.1% | -17.9% |
| French Orders | ||||||
| Saar exept m/mSep- | Sep-09 | Aug-09 | Jul-09 | 3-mo | 6-mo | 12-mo |
| Total | 5.7% | 2.9% | 4.7% | 67.4% | 33.8% | -5.6% |
| Foreign | 0.3% | 0.1% | 14.5% | 74.8% | 40.8% | -14.7% |
| IP xConstruct | -1.6% | 3.0% | 0.7% | 8.6% | 9.2% | -11.0% |

Tom Moeller
AuthorMore in Author Profile »Prior to joining Haver Analytics in 2000, Mr. Moeller worked as the Economist at Chancellor Capital Management from 1985 to 1999. There, he developed comprehensive economic forecasts and interpreted economic data for equity and fixed income portfolio managers. Also at Chancellor, Mr. Moeller worked as an equity analyst and was responsible for researching and rating companies in the economically sensitive automobile and housing industries for investment in Chancellor’s equity portfolio. Prior to joining Chancellor, Mr. Moeller was an Economist at Citibank from 1979 to 1984. He also analyzed pricing behavior in the metals industry for the Council on Wage and Price Stability in Washington, D.C. In 1999, Mr. Moeller received the award for most accurate forecast from the Forecasters' Club of New York. From 1990 to 1992 he was President of the New York Association for Business Economists. Mr. Moeller earned an M.B.A. in Finance from Fordham University, where he graduated in 1987. He holds a Bachelor of Arts in Economics from George Washington University.
More Economy in Brief

 Global| Feb 05 2026
Charts of the Week: Balanced Policy, Resilient Data and AI Narratives
by:Andrew Cates

