 Global| Apr 22 2021
U.S. Leading Indicators Rebounded in March
by:Sandy Batten
|in:Economy in Brief
Summary
• Rebound in leading index largest rise since last August. • All 10 components made a positive contribution in March. • Coincident indicators also rebounded in March. The Conference Board's Composite Index of Leading Economic [...]
• Rebound in leading index largest rise since last August.
• All 10 components made a positive contribution in March.
• Coincident indicators also rebounded in March.
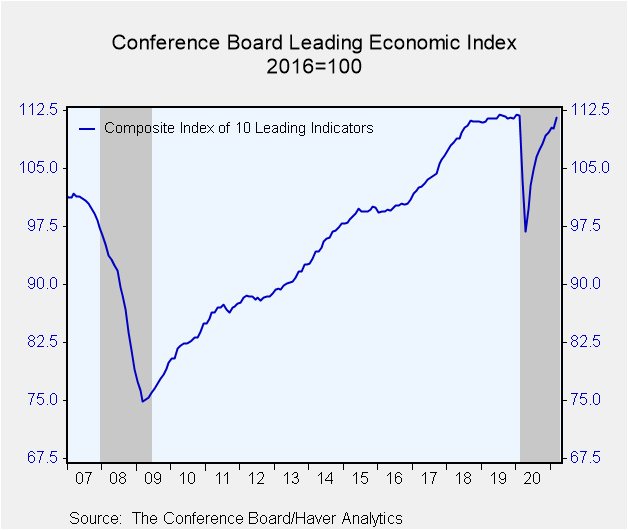
The Conference Board's Composite Index of Leading Economic Indicators rebounded in March, rising 1.3% m/m (+7.9% y/y) following a downwardly revised 0.1% m/m decline in February (initially +0.2% m/m). The Action Economics Forecast Survey anticipated a 0.9% rise in March. The Leading Index is comprised of 10 components which tend to precede changes in overall economic activity.
Each of the 10 components made a positive contribution in March, pointing to a near-term increase in economic momentum. The workweek was longer, initial unemployment insurance claims fell, manufacturers' orders increased, building permits improved, equity prices gained, the yield curve steepened and consumer expectations rose. The fall in unemployment insurance claims, the rise in new orders and the steepening yield curve were the major contributors to the March increase.
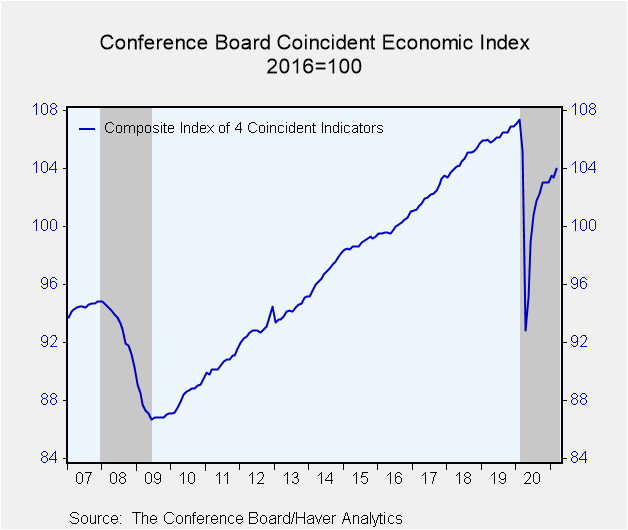
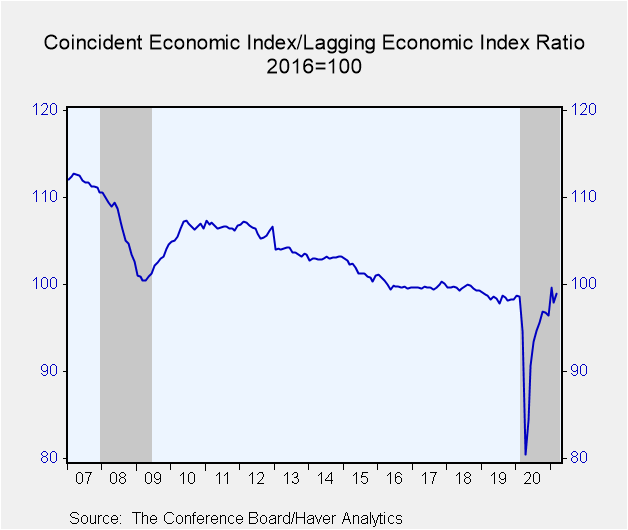
The Index of Coincident Economic Indicators increased 0.6% m/m (-1.1% y/y) in March following an unrevised 0.1% m/m decline in February. Each of the four component series contributed positively to the index with the March rebound in industrial production (after having been adversely impacted by severe winter weather in February) being the major contributor to the rise in the overall index.
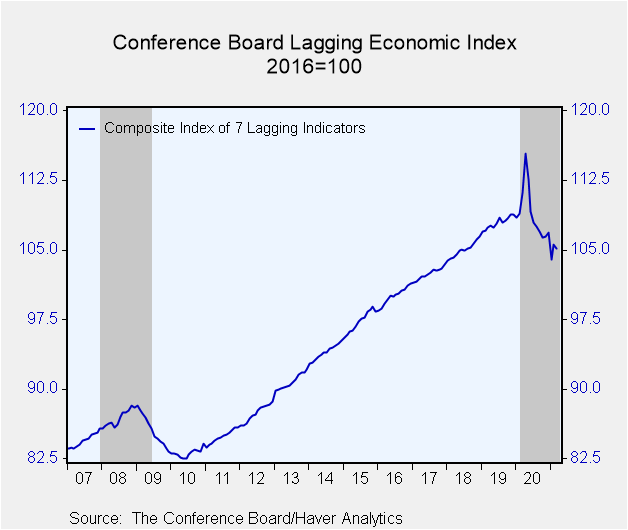
The Index of Lagging Indicators declined 0.5% m/m (-5.5% y/y) in March after an upwardly 1.6% m/m gain in February (initially +0.2% m/m). Weaker business and consumer loans and an increased duration of unemployment accounted for the monthly decline.
The Conference Board figures are available in Haver's BCI database; the components are available there, and most are also in USECON. The expectations are in the AS1REPNA database. Visit the Conference Board's site for coverage of leading indicator series from around the world.
| Business Cycle Indicators (%) | Mar | Feb | Jan | Mar Y/Y | 2020 | 2019 | 2018 |
|---|---|---|---|---|---|---|---|
| Leading | 1.3 | -0.1 | 0.5 | 7.9 | -4.9 | 1.6 | 5.6 |
| Coincident | 0.6 | -0.1 | 0.5 | -1.1 | -4.3 | 1.6 | 2.4 |
| Lagging | -0.5 | 1.6 | -2.7 | -5.5 | 1.0 | 2.8 | 2.5 |
Sandy Batten
AuthorMore in Author Profile »Sandy Batten has more than 30 years of experience analyzing industrial economies and financial markets and a wide range of experience across the financial services sector, government, and academia. Before joining Haver Analytics, Sandy was a Vice President and Senior Economist at Citibank; Senior Credit Market Analyst at CDC Investment Management, Managing Director at Bear Stearns, and Executive Director at JPMorgan. In 2008, Sandy was named the most accurate US forecaster by the National Association for Business Economics. He is a member of the New York Forecasters Club, NABE, and the American Economic Association. Prior to his time in the financial services sector, Sandy was a Research Officer at the Federal Reserve Bank of St. Louis, Senior Staff Economist on the President’s Council of Economic Advisors, Deputy Assistant Secretary for Economic Policy at the US Treasury, and Economist at the International Monetary Fund. Sandy has taught economics at St. Louis University, Denison University, and Muskingun College. He has published numerous peer-reviewed articles in a wide range of academic publications. He has a B.A. in economics from the University of Richmond and a M.A. and Ph.D. in economics from The Ohio State University.
More Economy in Brief
 Global| Feb 05 2026
Charts of the Week: Balanced Policy, Resilient Data and AI Narratives
by:Andrew Cates


