 Global| Oct 02 2018
U.S. Light Vehicle Sales Rebound to 10-Month High
Summary
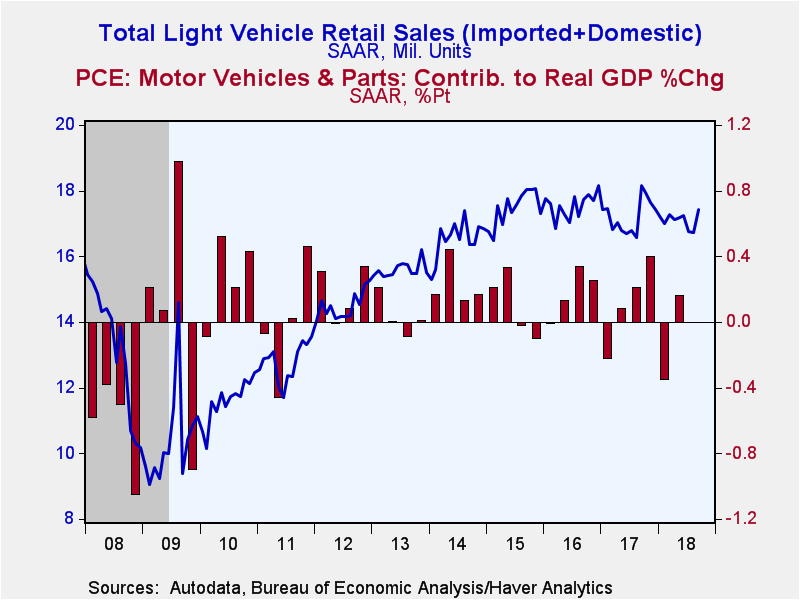
Sales of light vehicles totaled 17.44 million units (SAAR) in September, up 4.3% on the month but down 4.0% on the year. August's sales had been 16.72 million. The September results were the strongest since November 2017, when they [...]
Sales of light vehicles totaled 17.44 million units (SAAR) in September, up 4.3% on the month but down 4.0% on the year. August's sales had been 16.72 million. The September results were the strongest since November 2017, when they were 17.64 million.
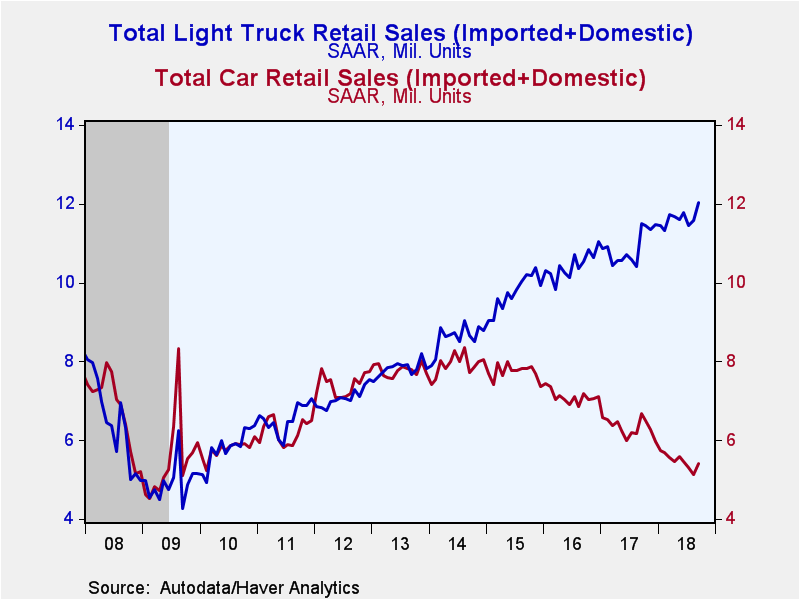
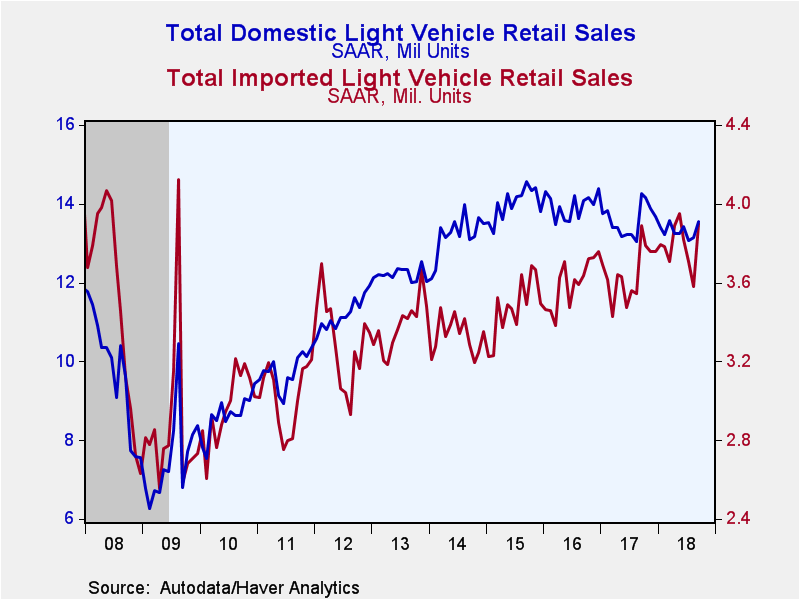
Passenger car sales rose 5.3% last month to 5.41 million units; despite this rebound, the longer-term trend in car sales put them down 18.9% from a year ago. Sales of domestically made cars almost exactly reversed their August decline, as they rose 3.8% in September to 3.91 million units, off 19.1% from a year ago. Sales of imported passenger cars rose 8.9% to 1.49 million units, but that is still down 18.8% from September 2017.
Light trucks, which of course include SUVs and widely used pick-up trucks, advanced 3.9% in September to 12.03 million units from 11.58 in August and were up 4.7% from September 2017's 11.49 million units. Sales of domestically made light trucks rose 2.8% to 9.63 million units, although that was up just 2.0% from the year-ago volume. Sales of imported light trucks reversed an August decline as they surged 8.6% in September (16.9% y/y) to 2.40 million, a new record.
Trucks' share of the U.S. vehicle market eased slightly to 69.0% last month from August's record 69.3%; this compared to 63.3% during all of last year and 48.8% during all of 2012.
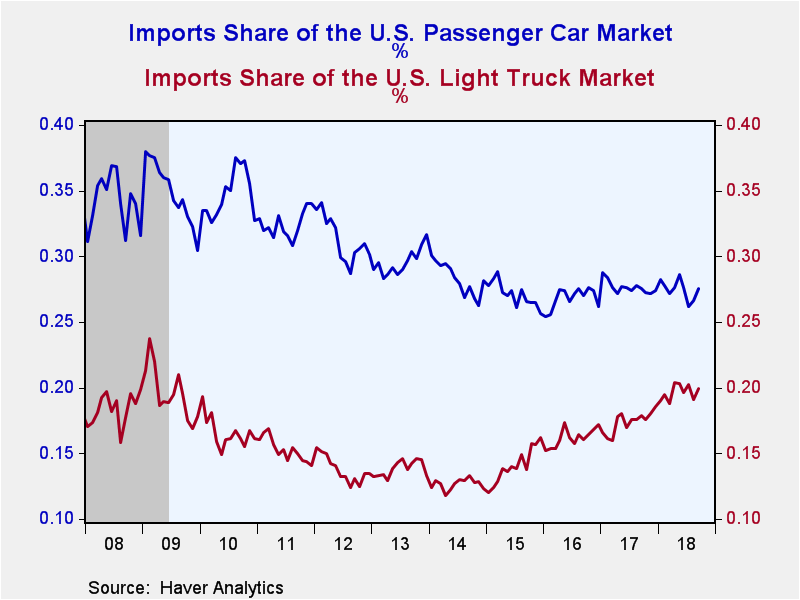
Imports' share of the U.S. vehicle market rose to 22.4% last month. Imports' share of the passenger car market increased to 27.5%. Imports share of the light truck market went up to 20.0% from 19.1% in August.
U.S. vehicle sales figures can be found in Haver's USECON database. Additional detail by manufacturer is in the INDUSTRY database.
| Sep | Aug | Jul | Sep Y/Y % | 2017 | 2016 | 2015 | |
|---|---|---|---|---|---|---|---|
| Total | 17.44 | 16.72 | 16.77 | -4.0 | 17.23 | 17.55 | 17.48 |
| Autos | 5.41 | 5.14 | 5.32 | -18.9 | 6.33 | 7.10 | 7.73 |
| Domestic | 3.91 | 3.77 | 3.93 | -19.1 | 4.58 | 5.20 | 5.64 |
| Imported | 1.49 | 1.37 | 1.39 | -18.8 | 1.75 | 1.90 | 2.10 |
| Light Trucks | 12.03 | 11.58 | 11.45 | 4.7 | 10.90 | 10.44 | 9.74 |
| Domestic | 9.63 | 9.37 | 9.14 | 2.0 | 9.00 | 8.75 | 8.37 |
| Imported | 2.40 | 2.21 | 2.32 | 16.9 | 1.90 | 1.69 | 1.38 |
Carol Stone, CBE
AuthorMore in Author Profile »Carol Stone, CBE came to Haver Analytics in 2003 following more than 35 years as a financial market economist at major Wall Street financial institutions, most especially Merrill Lynch and Nomura Securities. She has broad experience in analysis and forecasting of flow-of-funds accounts, the federal budget and Federal Reserve operations. At Nomura Securites, among other duties, she developed various indicator forecasting tools and edited a daily global publication produced in London and New York for readers in Tokyo. At Haver Analytics, Carol is a member of the Research Department, aiding database managers with research and documentation efforts, as well as posting commentary on select economic reports. In addition, she conducts Ways-of-the-World, a blog on economic issues for an Episcopal-Church-affiliated website, The Geranium Farm. During her career, Carol served as an officer of the Money Marketeers and the Downtown Economists Club. She has a PhD from NYU's Stern School of Business. She lives in Brooklyn, New York, and has a weekend home on Long Island.


