 Global| Mar 22 2013
U.S. Mass Layoff Events Near Cycle Low
by:Tom Moeller
|in:Economy in Brief
Summary
The employment market continues to firm. The Labor Department reported that layoffs of 50 or more persons from a single firm fell to 960 during February, near the cycle's low. That comes on the heels of a 7.8% decline to 17,080 during [...]
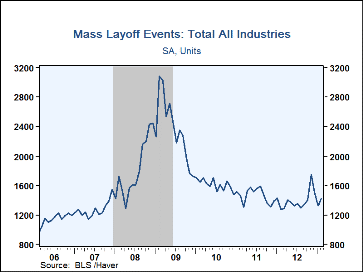
The employment market continues to firm. The Labor Department reported that layoffs of 50 or more persons from a single firm fell to 960 during February, near the cycle's low. That comes on the heels of a 7.8% decline to 17,080 during all of last year. On a seasonally adjusted basis, mass layoff events rose m/m to 1,422, but that was near the lowest since just before the last recession began.
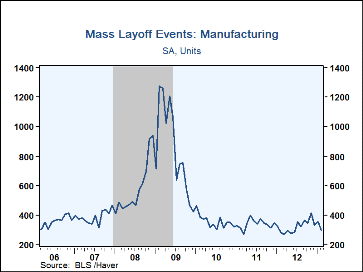
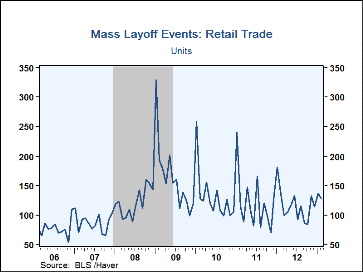
In February, construction layoffs fell by nearly one-half m/m yet still were up by one-quarter y/y. In manufacturing they fell 57.8% m/m to a record low. However, when seasonally adjusted, factory sector layoffs showed a lesser decline. During all of last year, the number of factory sector layoffs was down for the third straight year. Retail trade layoffs fell 5.9% m/m and 5.2% y/y. In most other industries, during the twelve months ended February the number of mass layoff events fell after declining for the full years 2012 and 2011.
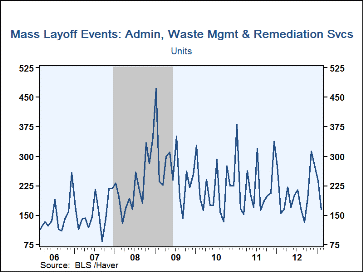
There were 79,786 initial claims for unemployment insurance accompanying these layoffs; 21,630 in manufacturing, 11,875 in administrative & waste services, 10,111 in retail trade and 2,907 in professional & technical services.
A mass layoff involves at least 50 initial claimants from a single establishment filing during a consecutive 5-week period. The BLS data are available in Haver's USECON database. Underlying state and area detail are available in the REGIONAL database.
| Mass Layoffs (NSA) | Feb | Jan | Dec | 2012 | 2011 | 2010 |
|---|---|---|---|---|---|---|
| Total All Industries | 960 | 1,528 | 1,973 | 17,080 | 18,521 | 19,564 |
| Private Nonfarm | 928 | 1,466 | 1,882 | 15,966 | 17,046 | 17,887 |
| Construction | 103 | 188 | 312 | 1,806 | 1,994 | 2,262 |
| Manufacturing | 192 | 455 | 477 | 3,886 | 4,397 | 4,523 |
| Retail Trade | 128 | 136 | 114 | 1,393 | 1,448 | 1,574 |
| Information | 37 | 36 | 31 | 441 | 522 | 548 |
| Finance & Insurance | 20 | 25 | 19 | 305 | 313 | 430 |
| Health Care & Social Assistance | 26 | 23 | 59 | 692 | 738 | 709 |
| Arts, Entertainment and Recreation | 12 | 32 | 19 | 329 | 338 | 363 |
| Government | 32 | 62 | 91 | 1,114 | 1,475 | 1,677 |
Tom Moeller
AuthorMore in Author Profile »Prior to joining Haver Analytics in 2000, Mr. Moeller worked as the Economist at Chancellor Capital Management from 1985 to 1999. There, he developed comprehensive economic forecasts and interpreted economic data for equity and fixed income portfolio managers. Also at Chancellor, Mr. Moeller worked as an equity analyst and was responsible for researching and rating companies in the economically sensitive automobile and housing industries for investment in Chancellor’s equity portfolio. Prior to joining Chancellor, Mr. Moeller was an Economist at Citibank from 1979 to 1984. He also analyzed pricing behavior in the metals industry for the Council on Wage and Price Stability in Washington, D.C. In 1999, Mr. Moeller received the award for most accurate forecast from the Forecasters' Club of New York. From 1990 to 1992 he was President of the New York Association for Business Economists. Mr. Moeller earned an M.B.A. in Finance from Fordham University, where he graduated in 1987. He holds a Bachelor of Arts in Economics from George Washington University.
More Economy in Brief
 Global| Feb 05 2026
Charts of the Week: Balanced Policy, Resilient Data and AI Narratives
by:Andrew Cates


