 Global| May 05 2021
U.S. Mortgage Applications Mixed, but Little Changed
Summary
• Applications to purchase edge downward, those for refinancing edge upward. • Mortgage interest rates mostly up, but changes very small. The Mortgage Bankers Association Mortgage Loan Applications Index decreased 0.9% (-5.9% y/y) in [...]
• Applications to purchase edge downward, those for refinancing edge upward.
• Mortgage interest rates mostly up, but changes very small.
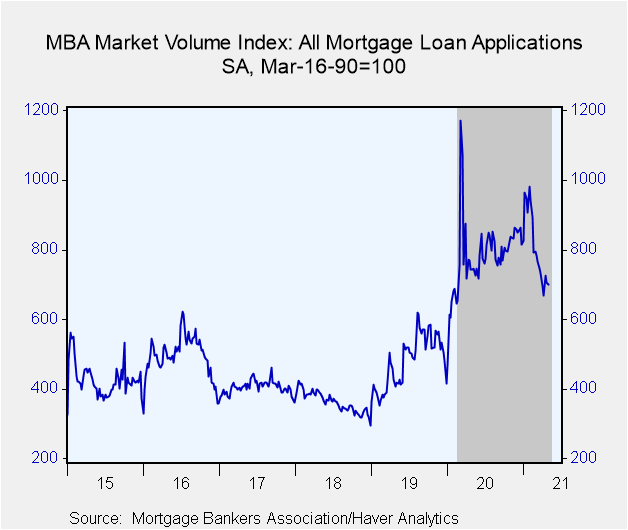
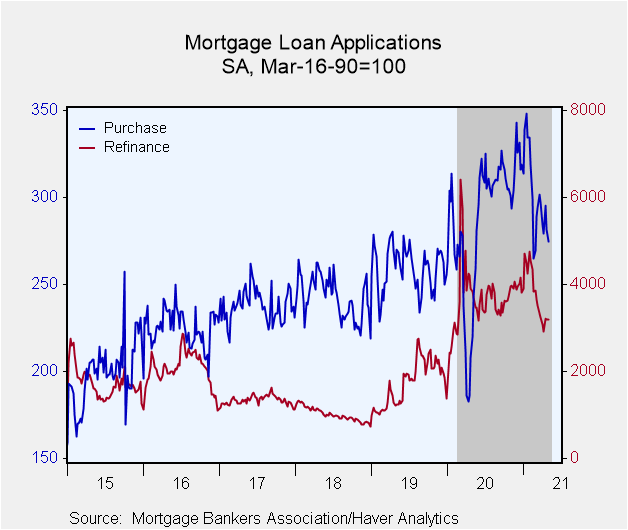
The Mortgage Bankers Association Mortgage Loan Applications Index decreased 0.9% (-5.9% y/y) in the week ended April 30, following a decline of 2.5% the previous week. Applications to purchase a home fell 2.5% (+24.8% y/y) after a 4.8% decline. Applications for refinancing edged upward 0.1% (-16.9% y/y) after decreasing 1.1% in the prior week.
The refinance share of mortgage activity edged upward to 61.0% of total applications, extending a steady rate close to 60% into a seventh week. The adjustable rate mortgage (ARM) share of activity rose to 3.9% last week.
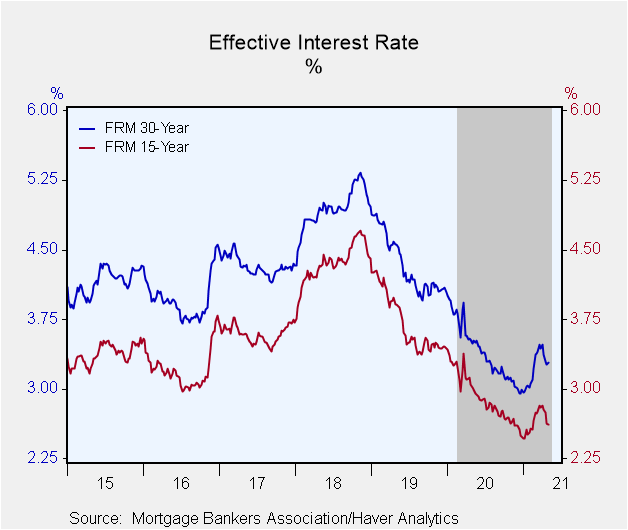
Mortgage interest rates changed little last week. The effective interest rate on a 30-year mortgage was 3.28%, up from 3.26% the prior week, and it remained above the 2.96% rate at the beginning of the year. The effective 15-year rate ticked downward to 2.62% from 2.63% and compares to 2.47% at the start of the year. The effective rate for a 30-year Jumbo mortgage edged up to 3.39% after falling to 3.37% in the prior week. The rate on a five-year ARM was 2.84% in the April 30 week, up from 2.76%
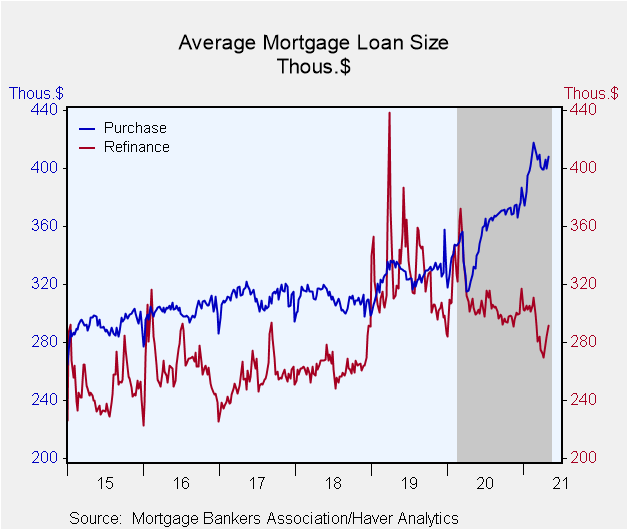
The average mortgage loan size increased to $337,000 in the April 30 week, up from $330,000 the prior week. The average size of a loan to purchase a house rose to $408,100 from $400,100. The average size of a refinance loan was $291,500, up from $284,300.
Applications for fixed-rate loans fell 1.3% (-6.7% y/y) last week following a 2.4% decline the week before and an increase of 8.5% the week before that (April 16). By contrast, applications for adjustable-rate mortgages increased 9.4% following a decline of 5.4% and an increase of 8.7%. So this application activity has been quite mixed, week to week.
This survey covers over 75% of all U.S. retail residential mortgage applications and has been conducted weekly since 1990. Respondents include mortgage bankers, commercial banks and thrifts. The base period and value for all indexes is March 16, 1990=100. The figures for weekly mortgage applications and interest rates are available in Haver's SURVEYW database.
| MBA Mortgage Applications (%, SA) | 04/30/21 | 04/23/21 | 04/16/21 | Y/Y | 2020 | 2019 | 2018 |
|---|---|---|---|---|---|---|---|
| Total Market Index | -0.9 | -2.5 | 8.6 | -5.9 | 63.0 | 32.4 | -10.4 |
| Purchase | -2.5 | -4.8 | 5.7 | 24.8 | 11.4 | 6.6 | 2.1 |
| Refinancing | 0.1 | -1.1 | 10.4 | -16.9 | 111.0 | 71.1 | -24.3 |
| 30-Year Effective Mortgage Interest Rate (%) | 3.28 | 3.26 | 3.30 | 3.54
(Apr '20) |
3.40 | 4.34 | 4.94 |
Carol Stone, CBE
AuthorMore in Author Profile »Carol Stone, CBE came to Haver Analytics in 2003 following more than 35 years as a financial market economist at major Wall Street financial institutions, most especially Merrill Lynch and Nomura Securities. She had broad experience in analysis and forecasting of flow-of-funds accounts, the federal budget and Federal Reserve operations. At Nomura Securities, among other duties, she developed various indicator forecasting tools and edited a daily global publication produced in London and New York for readers in Tokyo. At Haver Analytics, Carol was a member of the Research Department, aiding database managers with research and documentation efforts, as well as posting commentary on select economic reports. In addition, she conducted Ways-of-the-World, a blog on economic issues for an Episcopal-Church-affiliated website, The Geranium Farm. During her career, Carol served as an officer of the Money Marketeers and the Downtown Economists Club. She had a PhD from NYU's Stern School of Business. She lived in Brooklyn, New York, and had a weekend home on Long Island.
More Economy in Brief
 Global| Feb 05 2026
Charts of the Week: Balanced Policy, Resilient Data and AI Narratives
by:Andrew Cates


