 Global| Nov 25 2020
U.S. Mortgage Applications Rebound
by:Sandy Batten
|in:Economy in Brief
Summary
• Mortgage applications rebound following two weeks of decline. • Applications for both purchase and refinancing post marked increases. • Fixed mortgage rates fall to new all-time lows. The Mortgage Bankers Association Mortgage Loan [...]
• Mortgage applications rebound following two weeks of decline.
• Applications for both purchase and refinancing post marked increases.
• Fixed mortgage rates fall to new all-time lows.
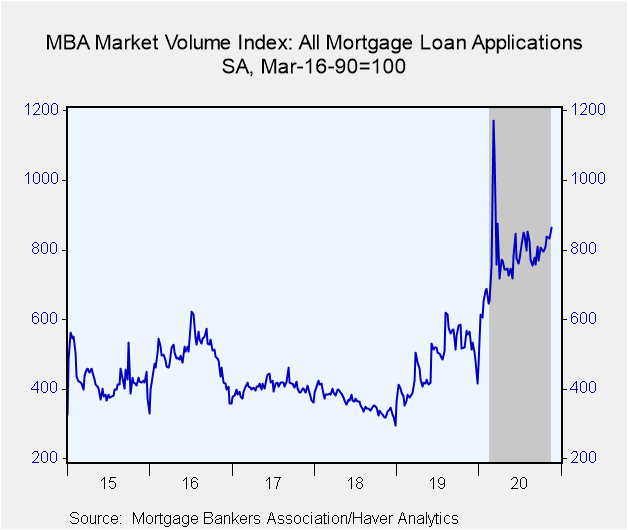
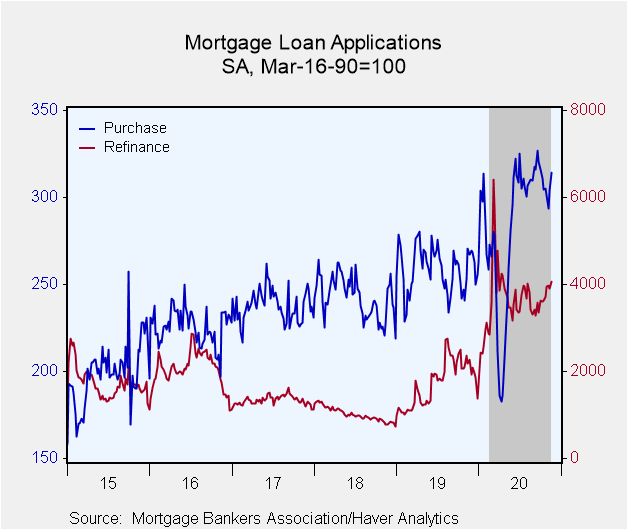
The Mortgage Bankers Association Mortgage Loan Applications Index rebounded in the week ended November 20, rising 3.9% w/w (+53.1% y/y) following two consecutive weekly declines. Purchase applications rose 3.5% w/w (+17.8 y/y), the same increase as in the previous week. Applications to refinance a loan jumped up 4.5% w/w (+78.7% y/y), more than offsetting their 1.8% decline the previous week. The refinancing share of total applications rose to 71.1% from 69.8% the previous week. Adjustable rate mortgages' share of the total number of applications was unchanged at 1.9%.
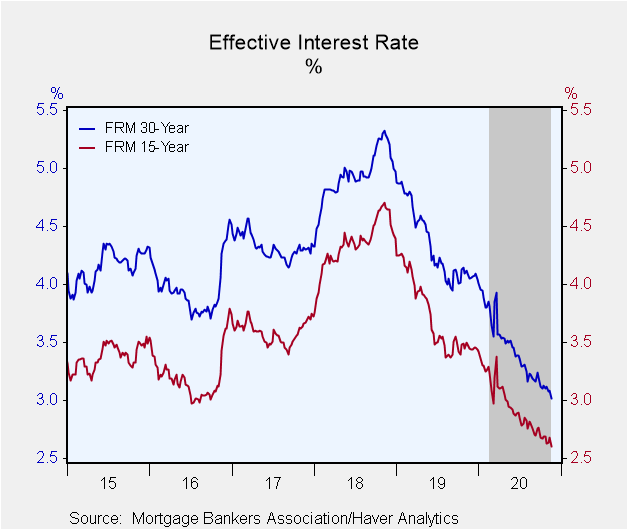
Interest rates generally fell this past week with the 30-year fixed rate mortgage rate falling seven basis points to 3.02%, a new all-time low. The rate on 15-year loans declined eight basis points to 2.60%, also a new all-time low. These series began in January 1990. The effective rate for a Jumbo mortgage rose to 3.26% from a record low 3.19% in the previous week. The rate on the 5-year adjustable rate mortgage plunged 24 basis points to 2.79%, its lowest level since May 2013.
The average mortgage loan size rose 1.2% w/w to $318,300 (+1.6% y/y) in the week ended November 20. The average size of a purchase loan increased 1.4% to $374,100 (+12.9% y/y), a new record high. The average loan size to refinance gained 1.5% to $295,600 (-2.2% y/y).
Applications for fixed-rate loans rose 3.9% w/w (+57.8% y/y) and applications for adjustable-rate mortgages increased 3.4% w/w (-39.9% y/y).
The survey covers over 75% of all U.S. retail residential mortgage applications and has been conducted weekly since 1990. Respondents include mortgage bankers, commercial banks and thrifts. The base period and value for all indexes is March 16, 1990=100. The figures for weekly mortgage applications and interest rates are available in Haver's SURVEYW database.
| MBA Mortgage Applications (%, SA) | 11/20/20 | 11/13/20 | 11/06/20 | Y/Y | 2019 | 2018 | 2017 |
|---|---|---|---|---|---|---|---|
| Total Market Index | 3.9 | -0.3 | -0.5 | 53.1 | 32.4 | -10.4 | -17.8 |
| Purchase | 3.5 | 3.5 | -2.6 | 17.8 | 6.6 | 2.1 | 5.6 |
| Refinancing | 4.5 | -1.8 | 0.6 | 78.7 | 71.1 | -24.3 | -34.0 |
| 30-Year Effective Mortgage Interest Rate (%) | 3.02 | 3.09 | 3.08 | 4.08
(Nov '19) |
4.34 | 4.94 | 4.32 |
Sandy Batten
AuthorMore in Author Profile »Sandy Batten has more than 30 years of experience analyzing industrial economies and financial markets and a wide range of experience across the financial services sector, government, and academia. Before joining Haver Analytics, Sandy was a Vice President and Senior Economist at Citibank; Senior Credit Market Analyst at CDC Investment Management, Managing Director at Bear Stearns, and Executive Director at JPMorgan. In 2008, Sandy was named the most accurate US forecaster by the National Association for Business Economics. He is a member of the New York Forecasters Club, NABE, and the American Economic Association. Prior to his time in the financial services sector, Sandy was a Research Officer at the Federal Reserve Bank of St. Louis, Senior Staff Economist on the President’s Council of Economic Advisors, Deputy Assistant Secretary for Economic Policy at the US Treasury, and Economist at the International Monetary Fund. Sandy has taught economics at St. Louis University, Denison University, and Muskingun College. He has published numerous peer-reviewed articles in a wide range of academic publications. He has a B.A. in economics from the University of Richmond and a M.A. and Ph.D. in economics from The Ohio State University.
More Economy in Brief
 Global| Feb 05 2026
Charts of the Week: Balanced Policy, Resilient Data and AI Narratives
by:Andrew Cates


