 Global| Jul 01 2020
U.S. Mortgage Loan Applications Down 35% from Early March High
Summary
• Mortgage applications decreased 1.8% in week ending June 26. • 15-year fixed rate mortgage edges up to 2.90%, near record low of 2.87%. The Mortgage Bankers Association reported that its total Mortgage Applications Index declined [...]
• Mortgage applications decreased 1.8% in week ending June 26.
• 15-year fixed rate mortgage edges up to 2.90%, near record low of 2.87%.
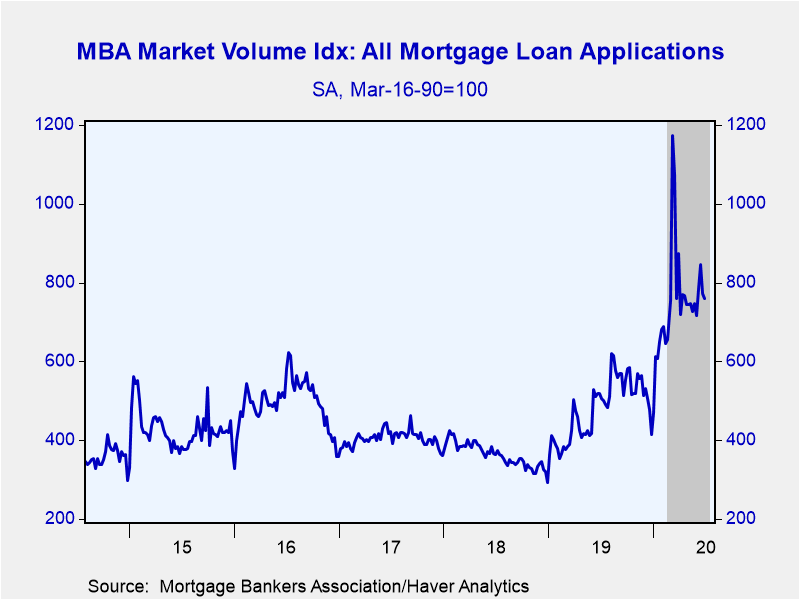
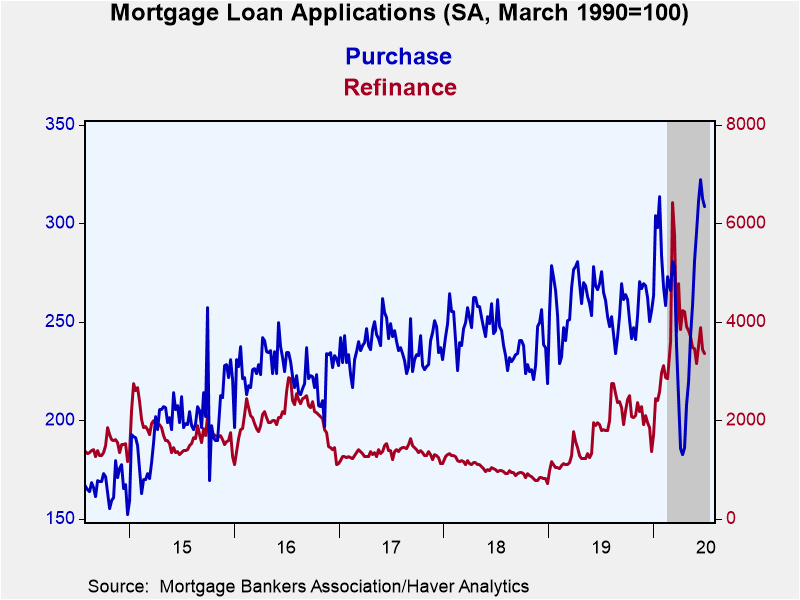
The Mortgage Bankers Association reported that its total Mortgage Applications Index declined 1.8% (+46.5% year-on-year) during the week ending June 26. Applications to purchase a home decreased 1.3% (+14.6% y/y), while refinance activity was down 2.2% (+74.4% y/y). After spiking in to an 11-year high early March as interest rates dropped, mortgage applications fell in the second half of March and have been range-bound since. Total applications down are 35.3% from the March peak; refinancing has fallen 47.7%, while purchase is down 4.3% from the 11-year high reached on June 12.
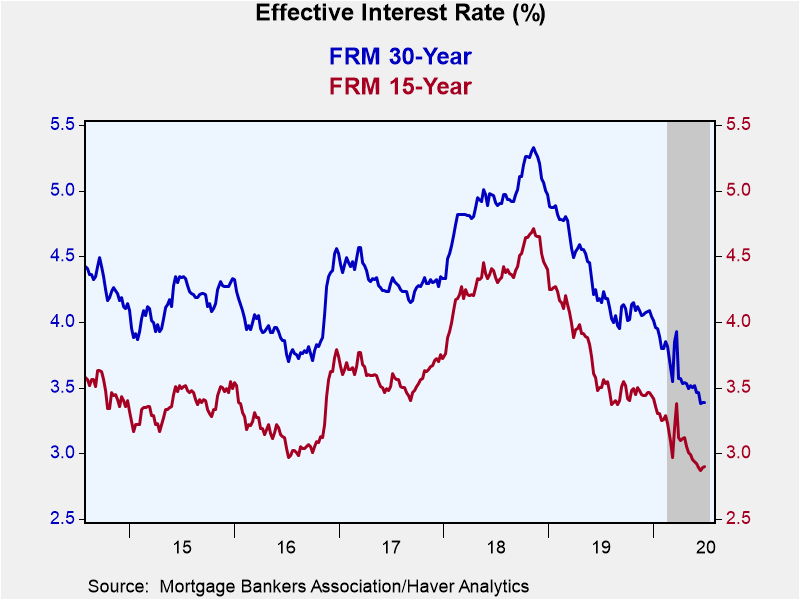
The effective interest rate on a 15-year fixed-rate mortgage edged up to 2.90%, it reached a record low of 2.87% in the week ending June 12. While Treasury rates have been range-bound since early April mortgage rates have continued to decline as risk premia -- the compensation for lending in riskier markets -- have fallen. Thirty-year fixed rates were unchanged at 3.39% up one basis point from their record low of 3.38%. Thirty-year jumbo rates ticked down to 3.68% slightly above the early March record of 3.64%. Five-year adjustable rates decreased to 3.03% the lowest level since 2016.
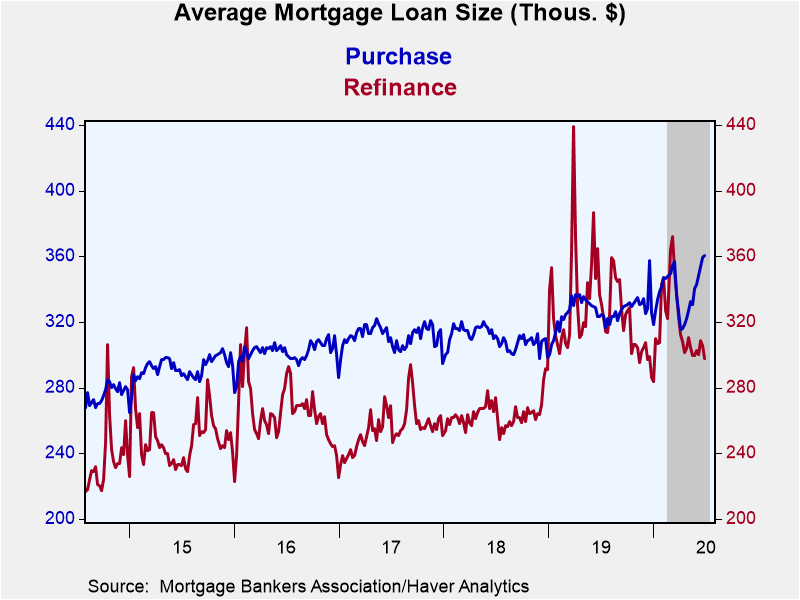
The average mortgage loan size declined to $322,200 (-2.4% y/y), down meaningfully from the early-March high of $367,900. For purchases the average loan size increased to $360,300 (11.5% y/y) while refinancing loans decreased to $298,000 (-11.5% y/y).
With fixed mortgage interest rates falling substantially more than adjustable rates, applications for fixed-rate loans are up 49.7% y/y while adjustable rate mortgages are down 11.0% y/y.
The survey covers over 75% of all U.S. retail residential mortgage applications and has been conducted weekly since 1990. Respondents include mortgage bankers, commercial banks and thrifts. The base period and value for all indexes is March 16, 1990=100. The figures for weekly mortgage applications and interest rates are available in Haver's SURVEYW database.
| MBA Mortgage Applications (%, SA) | 06/26/20 | 06/19/20 | 06/12/20 | Y/Y | 2019 | 2018 | 2017 |
|---|---|---|---|---|---|---|---|
| Total Market Index | -1.8 | -8.7 | 8.0 | 46.5 | 32.4 | -10.4 | -17.8 |
| Purchase | -1.3 | -3.0 | 3.5 | 14.6 | 6.6 | 2.1 | 5.6 |
| Refinancing | -2.2 | -11.7 | 10.3 | 74.4 | 71.1 | -24.3 | -34.0 |
| 15-Year Effective Mortgage Interest Rate (%) | 2.90 | 2.89 | 2.87 |
3.54 |
3.71 | 4.35 | 3.59 |
Gerald D. Cohen
AuthorMore in Author Profile »Gerald Cohen provides strategic vision and leadership of the translational economic research and policy initiatives at the Kenan Institute of Private Enterprise.
He has worked in both the public and private sectors focusing on the intersection between financial markets and economic fundamentals. He was a Senior Economist at Haver Analytics from January 2019 to February 2021. During the Obama Administration Gerald was Deputy Assistant Secretary for Macroeconomic Analysis at the U.S. Department of Treasury where he helped formulate and evaluate the impact of policy proposals on the U.S. economy. Prior to Treasury, he co-managed a global macro fund at Ziff Brothers Investments.
Gerald holds a bachelor’s of science from the Massachusetts Institute of Technology and a Ph.D. in Economics from Harvard University and is a contributing author to 30-Second Money as well as a co-author of Political Cycles and the Macroeconomy.
More Economy in Brief
 Global| Feb 05 2026
Charts of the Week: Balanced Policy, Resilient Data and AI Narratives
by:Andrew Cates


