 Global| Aug 23 2019
U.S. New Home Sales Disappoint in July But Large Upward Revision to June
by:Sandy Batten
|in:Economy in Brief
Summary
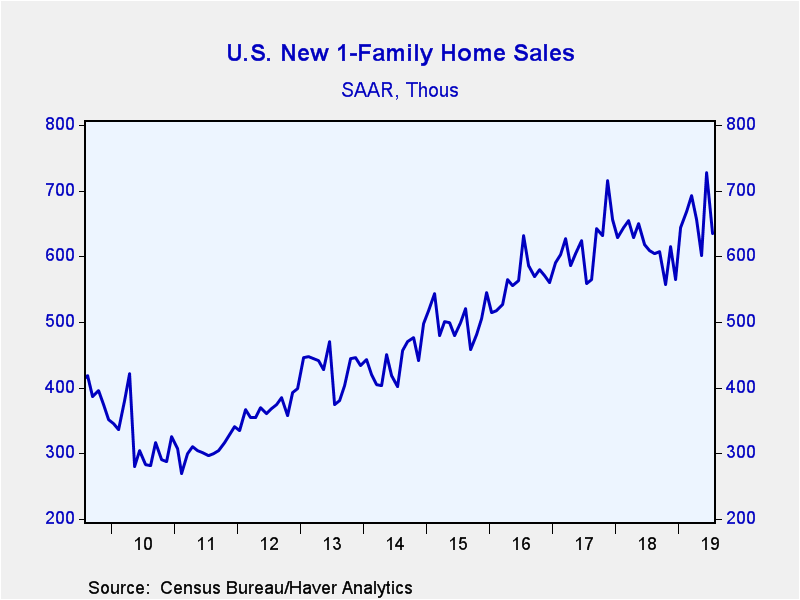
New home sales declined 12.8% m/m (+4.3% y/y) in July to 635,000 (SAAR) from 728,000 in June, a massive upward revision from the initially reported 646,000. Sales in May were revised down slightly to 602,000 from 604,000. Sales of [...]
New home sales declined 12.8% m/m (+4.3% y/y) in July to 635,000 (SAAR) from 728,000 in June, a massive upward revision from the initially reported 646,000. Sales in May were revised down slightly to 602,000 from 604,000. Sales of 640,000 had been expected in the Action Economics Forecast Survey. Despite the latest decline, new home sales remained 14.0% higher than the recent low in October. These sales transactions are recorded when sales contracts are signed or deposits are made.
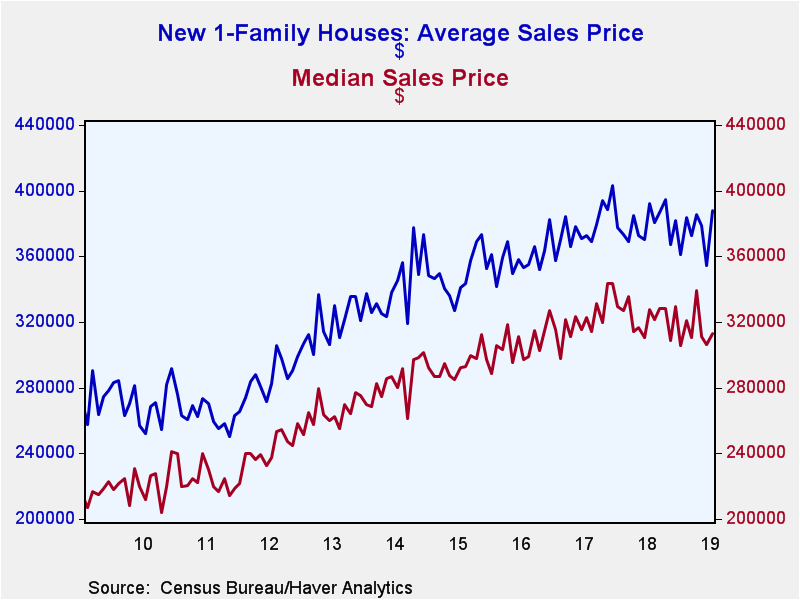
The median price of a new home increased 2.2% m/m (-4.5% y/y) to $312,800 last month. The rise more-than reversed the prior month's decline to $306,000, revised from $310,400. Prices remained 8.9% below the record high of $343,400 in November 2017. The average price of a new home jumped up 9.5% m/m (-1.1% y/y) to $388,000.
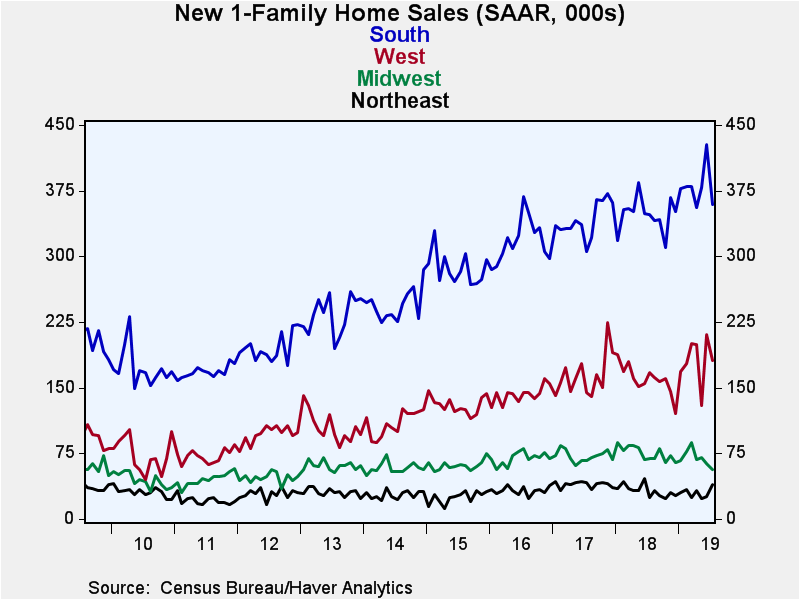
Sales were generally down across the regions of the country in July. New home sales in the Northeast jumped up 50% m/m (56% y/y). In contrast, monthly sales fell in the other three regions. Sales declined 11.1% m/m (-18.8% y/y) in the Midwest; declined 16.1% m/m (+3.2% y/y) in the South, and fell 14.2% m/m (+8.4% y/y) in the West
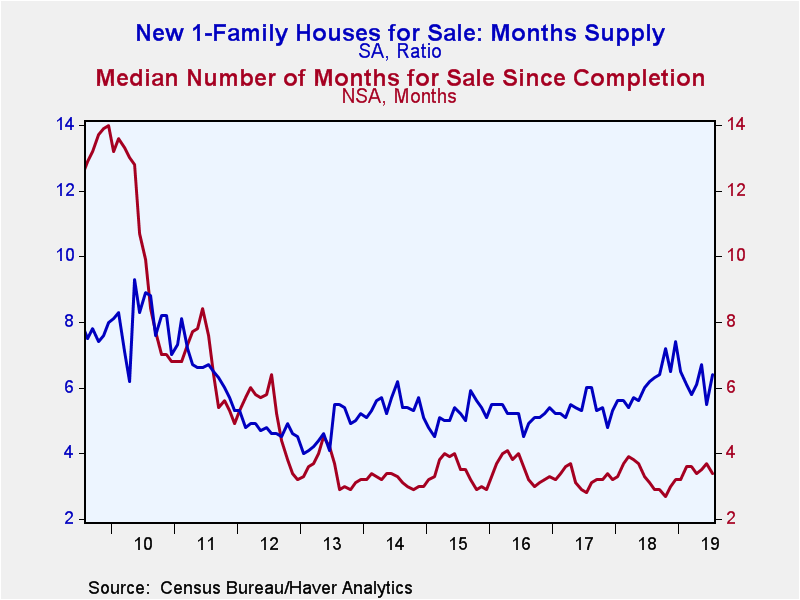
The months' supply of homes on the market rebounded to 6.4 in July from a 15-month low of 5.5 in June but remained well below the recent high of 7.4 months reached last December. The median number of months a new home was on the market after its completion eased to 3.4 months but was still above the recent low of 2.7 months in last October.
The data in this report are available in Haver's USECON database. The consensus expectation figure from Action Economics is available in the AS1REPNA database.
"Challenges for Monetary Policy" from Federal Reserve Chair Jerome H. Powell is available here.
| U.S. New Single-Family Home Sales (SAAR, 000s) | July | June | May | July Y/Y % | 2018 | 2017 | 2016 |
|---|---|---|---|---|---|---|---|
| Total | 635 | 728 | 602 | 4.3 | 615 | 617 | 562 |
| Northeast | 39 | 26 | 23 | 56.0 | 32 | 40 | 32 |
| Midwest | 56 | 63 | 70 | -18.8 | 75 | 72 | 69 |
| South | 359 | 428 | 379 | 3.2 | 348 | 341 | 318 |
| West | 181 | 211 | 130 | 8.4 | 160 | 164 | 142 |
| Median Price (NSA, $) | 312,800 | 306,000 | 311,000 | -4.5 | 323,125 | 321,633 | 306,500 |
Sandy Batten
AuthorMore in Author Profile »Sandy Batten has more than 30 years of experience analyzing industrial economies and financial markets and a wide range of experience across the financial services sector, government, and academia. Before joining Haver Analytics, Sandy was a Vice President and Senior Economist at Citibank; Senior Credit Market Analyst at CDC Investment Management, Managing Director at Bear Stearns, and Executive Director at JPMorgan. In 2008, Sandy was named the most accurate US forecaster by the National Association for Business Economics. He is a member of the New York Forecasters Club, NABE, and the American Economic Association. Prior to his time in the financial services sector, Sandy was a Research Officer at the Federal Reserve Bank of St. Louis, Senior Staff Economist on the President’s Council of Economic Advisors, Deputy Assistant Secretary for Economic Policy at the US Treasury, and Economist at the International Monetary Fund. Sandy has taught economics at St. Louis University, Denison University, and Muskingun College. He has published numerous peer-reviewed articles in a wide range of academic publications. He has a B.A. in economics from the University of Richmond and a M.A. and Ph.D. in economics from The Ohio State University.
More Economy in Brief
 Global| Feb 05 2026
Charts of the Week: Balanced Policy, Resilient Data and AI Narratives
by:Andrew Cates


