 Global| Sep 26 2017
U.S. New Home Sales & Prices Decline
by:Tom Moeller
|in:Economy in Brief
Summary
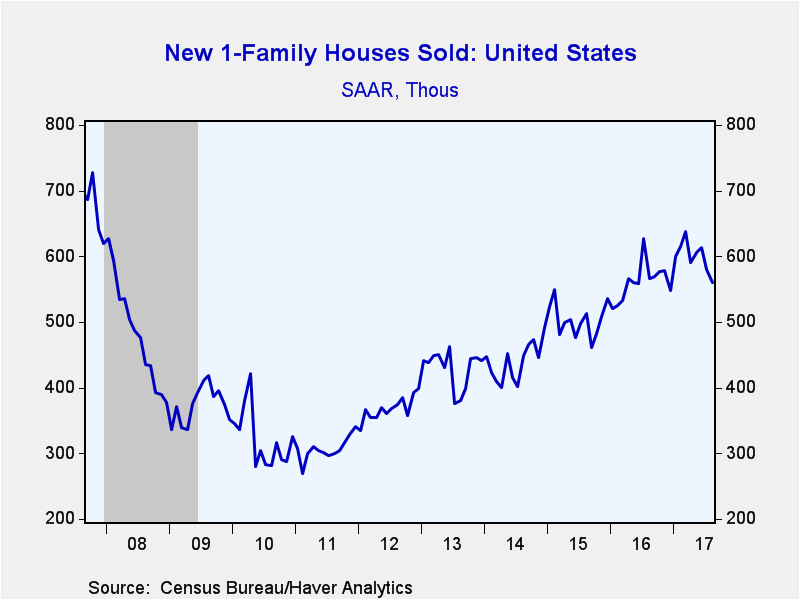
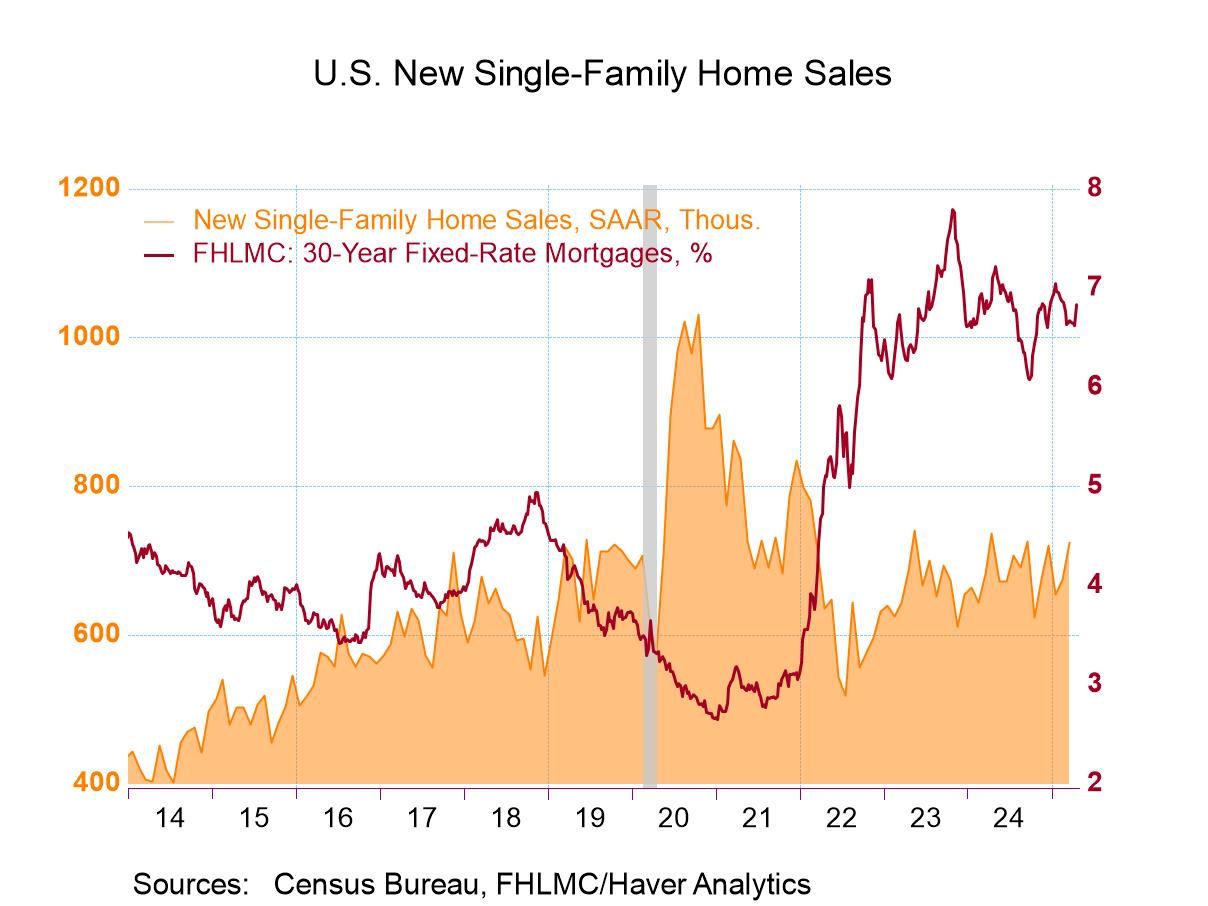
Sales of new single-family homes fell 3.4% (-1.2% y/y) to 560,000 during August, following a 5.5% drop in July to 580,000, revised from 571,000. August sales were at the lowest level since December. The figures do not include the full [...]
Sales of new single-family homes fell 3.4% (-1.2% y/y) to 560,000 during August, following a 5.5% drop in July to 580,000, revised from 571,000. August sales were at the lowest level since December. The figures do not include the full effects due to Hurricane Harvey. Expectations in the Action Economics Forecast Survey had been for 585,000 sales.
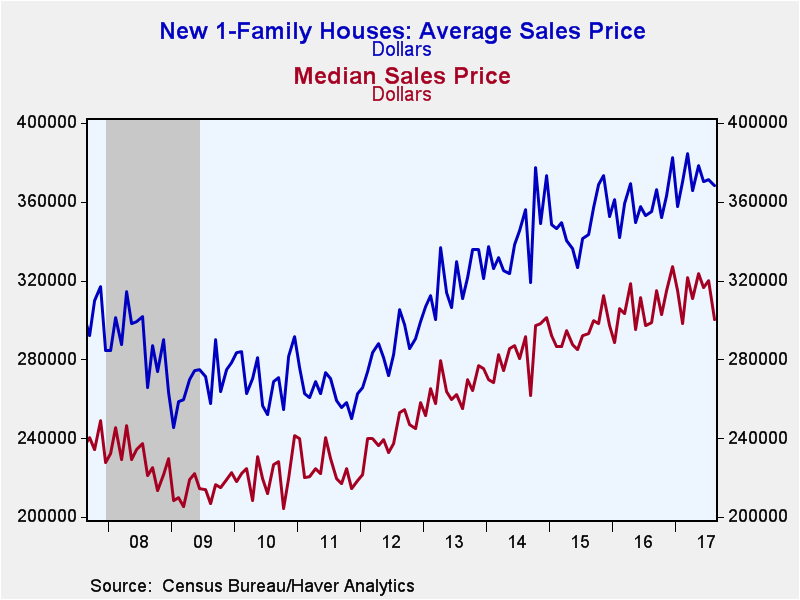
The median price of a new home declined 6.2% (+0.4% y/y) to $300,200 from $319,900. It was the lowest level in six months. The average price of a new home eased 0.9% (+3.7% y/y) to $368,100.
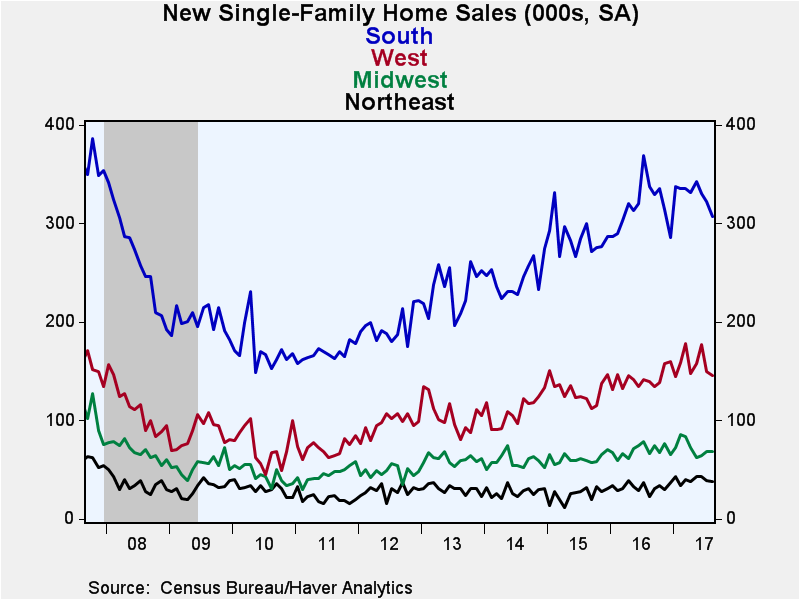
Movement in home sales was mixed around the country, with weakness led last month by a 4.7% decline (-9.2% y/y) in the South to 307,000, the third straight month of decline. In the West, sales fell 2.7% (+4.3% y/y) to 146,000 after a 15.3% drop. New home sales in the Northeast declined 2.6%, up two-thirds y/y, to 38,000 after a 9.3% drop. In the Midwest, sales held steady m/m (+4.5% y/y) at 69,000 following a 7.8% gain in July.
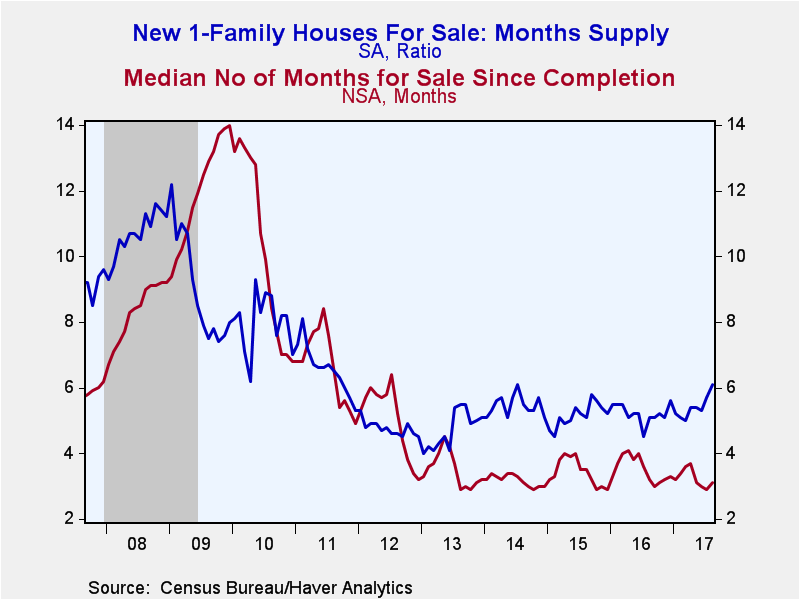
There was a 6.1 months' supply of homes for sale at the current sales rate. It was the highest level since July 2014. The median number of months a new home was on the market rose slightly to 3.1.
Why Persistent Employment Disparities Matter for the Economy's Health is the title of today's speech by Fed Chair Janet L. Yellen and it can be found here.
The data in this report are available in Haver's USECON database. The consensus expectation figure from Action Economics is available in the AS1REPNA database.
| U.S. New Single-Family Home Sales (SAAR, 000s) | Aug | Jul | Jun | Aug Y/Y % | 2016 | 2015 | 2014 |
|---|---|---|---|---|---|---|---|
| Total | 560 | 580 | 614 | -1.2 | 561 | 503 | 440 |
| Northeast | 38 | 39 | 43 | 65.1 | 32 | 25 | 28 |
| Midwest | 69 | 69 | 64 | 4.5 | 69 | 61 | 58 |
| South | 307 | 322 | 330 | -9.2 | 317 | 286 | 244 |
| West | 146 | 150 | 177 | 4.3 | 142 | 130 | 110 |
| Median Price (NSA, $) | 300,200 | 319,900 | 316,300 | 0.4 | 310,567 | 297,258 | 283,775 |
Tom Moeller
AuthorMore in Author Profile »Prior to joining Haver Analytics in 2000, Mr. Moeller worked as the Economist at Chancellor Capital Management from 1985 to 1999. There, he developed comprehensive economic forecasts and interpreted economic data for equity and fixed income portfolio managers. Also at Chancellor, Mr. Moeller worked as an equity analyst and was responsible for researching and rating companies in the economically sensitive automobile and housing industries for investment in Chancellor’s equity portfolio. Prior to joining Chancellor, Mr. Moeller was an Economist at Citibank from 1979 to 1984. He also analyzed pricing behavior in the metals industry for the Council on Wage and Price Stability in Washington, D.C. In 1999, Mr. Moeller received the award for most accurate forecast from the Forecasters' Club of New York. From 1990 to 1992 he was President of the New York Association for Business Economists. Mr. Moeller earned an M.B.A. in Finance from Fordham University, where he graduated in 1987. He holds a Bachelor of Arts in Economics from George Washington University.


