 Global| Dec 27 2012
U.S. New Home Sales Rebound to 2-1/2-Year High
Summary
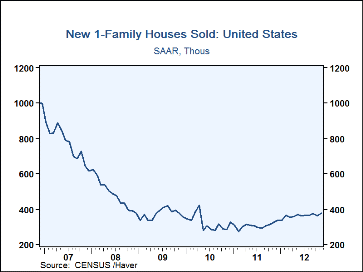
New home sales reversed their October decline in November, as they gained 4.4% to a 377,000 annual rate (+15.3% y/y). This was the largest monthly amount since April 2010. The October result was revised to 361,000 from 368,000 [...]
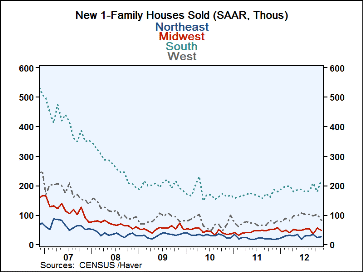
New home sales reversed their October decline in November, as they gained 4.4% to a 377,000 annual rate (+15.3% y/y). This was the largest monthly amount since April 2010. The October result was revised to 361,000 from 368,000 reported initially. The November result was close to consensus forecasts of 380,000. Sales in the Northeast and South, which had both fallen in October, rebounded, with those in the Northeast up 12.5% to 27,000 (+68.8% y/y) and those in the South up 21.1% to 218,000 (17.2% y/y). Conversely, new home sales in the Midwest and West also reversed October's performances with declines now following increases; those in the Midwest were down 12.5% to 49,000 (-5.8% y/y) and in the West sales were down 17.8% to 83,000 (+13.8% y/y).
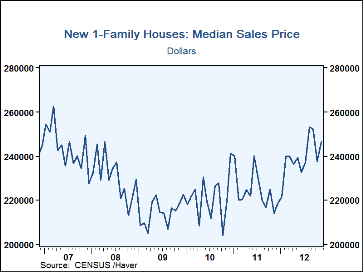
House prices recovered some of their October decline as the median price went up 3.7% in November to $246,200 (+14.7% y/y). The average price gained 10.1% in November $299,700 (+19.9% y/y).
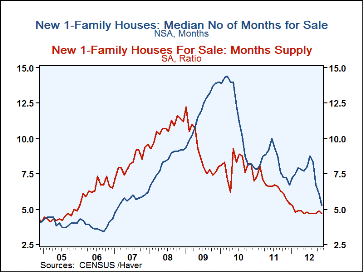
The length of time to sell a new home continued down, reaching 5.3 months in November from a revised 6.1 months in October fell sharply m/m. November's time on the market was the shortest since February 2007. The inventory of unsold homes rose very slightly to 149,000 from October's 147,000 (-3.9% y/y) remained near its all time low. This represents 4.7 months of sales at the current rate, the shortest since the summer of 2005.
The data in this report are available in Haver's USECON database. The consensus expectation figure is from the Action Economics survey and is available in the AS1REPNA database.
| U.S. New Home Sales | |||||||
|---|---|---|---|---|---|---|---|
| Nov | Oct | Sep | Y/Y % | 2011 | 2010 | 2009 | |
| Total (SAAR, 000s) | 377 | 361 | 374 | 15.3 | 307 | 321 | 374 |
| Northeast | 27 | 24 | 33 | 68.8 | 21 | 31 | 31 |
| Midwest | 49 | 56 | 37 | -5.8 | 45 | 45 | 54 |
| South | 218 | 180 | 208 | 17.2 | 169 | 173 | 202 |
| West | 83 | 101 | 96 | 13.7 | 72 | 74 | 87 |
| Median Price (NSA, $) | $246,200 | $237,500 | $252,100 | 14.7 | $224,317 | $221,242 | $214,500 |
Carol Stone, CBE
AuthorMore in Author Profile »Carol Stone, CBE came to Haver Analytics in 2003 following more than 35 years as a financial market economist at major Wall Street financial institutions, most especially Merrill Lynch and Nomura Securities. She has broad experience in analysis and forecasting of flow-of-funds accounts, the federal budget and Federal Reserve operations. At Nomura Securites, among other duties, she developed various indicator forecasting tools and edited a daily global publication produced in London and New York for readers in Tokyo. At Haver Analytics, Carol is a member of the Research Department, aiding database managers with research and documentation efforts, as well as posting commentary on select economic reports. In addition, she conducts Ways-of-the-World, a blog on economic issues for an Episcopal-Church-affiliated website, The Geranium Farm. During her career, Carol served as an officer of the Money Marketeers and the Downtown Economists Club. She has a PhD from NYU's Stern School of Business. She lives in Brooklyn, New York, and has a weekend home on Long Island.


