 Global| Dec 02 2005
U.S. Payrolls Up
by:Tom Moeller
|in:Economy in Brief
Summary
In November, non-farm payrolls posted the largest gain since July. The 215,000 increase matched Consensus expectations and followed a 44,000 October rise that was slightly lower than initially reported, but the September figure was [...]
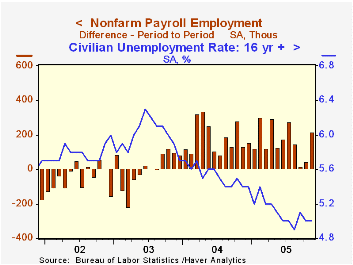
In November, non-farm payrolls posted the largest gain since July. The 215,000 increase matched Consensus expectations and followed a 44,000 October rise that was slightly lower than initially reported, but the September figure was revised to up 17,000 from a previously reported 8,000 drop.
From the household survey the unemployment rate held at 5.0%, as expected. Employment fell 52,000 (+1.6% y/y) after a 214,000 rise in October and the labor force rose 97,000 (1.3% y/y).
Factory sector payrolls increased 11,000 (-0.5% y/y). Together with a 15,000 worker rise in October, the figure marked the first time since early last year that factory payrolls have risen in consecutive months. Some improvement in the breadth across industries of job gains was suggested by the sector's one month diffusion index which rose to 51.8%, its highest level since July of last year.
Construction employment rose 37,000 (4.2% y/y), up a bit from the 28,000 average during the prior three months.
Payrolls in private service producing industries rose 144,000 (1.8% y/y) after a little revised 5,000 worker decline in October. Education & health services jobs increased 36,000 (2.2% y/y) and returned to the earlier pace after an October decline. Retail trade added 8,500 (0.7% y/y) jobs but a larger 29,000 (2.8% y/y) gain was posted by professional & business services. Jobs in financial services rose 13,000 (2.4% y/y) and leisure & hospitality recovered 29,000 (1.6% y/y) after two months of decline.
The gain in average hourly earnings eased to an expected 0.2% after the upwardly revised 0.6% spike in October. Factory sector earnings rose 0.2% (2.5% y/y) but private service sector earnings fell 0.1% (+3.4% y/y).
Today's remarks by Federal Reserve Board Chairman Alan Greenspan on Budget Policy can be found here.
| Employment | Nov | Oct | Y/Y | 2004 | 2003 | 2002 |
|---|---|---|---|---|---|---|
| Payroll Employment | 215,000 | 44,000 | 1.5% | 1.1% | -0.3% | -1.1% |
| Manufacturing | 11,000 | 15,000 | -0.5% | -1.2% | -4.9% | -7.2% |
| Average Weekly Hours | 33.7 | 33.8 | 33.7 (Nov '04) | 33.7 | 33.7 | 33.8 |
| Average Hourly Earnings | 0.2% | 0.6% | 3.2% | 2.1% | 2.7% | 2.9% |
| Unemployment Rate | 5.0% | 5.0% | 5.4% (Nov '04) | 5.5% | 6.0% | 5.8% |
by Tom Moeller December 2, 2005
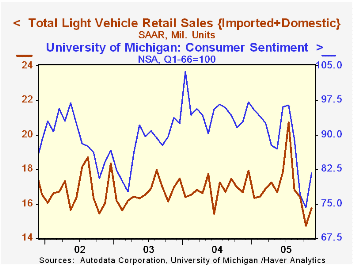
According to the Autodata Corporation, November US sales of light vehicles recovered most of the prior month's decline with a 6.7% m/m rise to 15.74M. The increase, however, failed to recoup the decline during the prior three months. As a result, the average of sales so far during 2005 is about equal to all of 2004.
Sales of US made cars & trucks improved 8.6% m/m. Domestic truck sales rose 11.8% (-11.8% y/y) while car sales rose a lesser 4.8% (2.6% y/y).
Sales of imported cars & trucks rose a modest 0.2% m/m (-3.3% y/y) as sales of imported trucks rose 0.8% (-8.5% y/y) and imported auto sales fell slightly (-0.5% y/y).
Import's share of the US light vehicle market slipped m/m to 21.2%.
| Light Vehicle Sales (SAAR, Mil. Units) | Nov | Oct | Y/Y | 2004 | 2003 | 2002 |
|---|---|---|---|---|---|---|
| Total | 15.74 | 14.75 | -5.5% | 16.87 | 16.63 | 16.81 |
| Autos | 7.56 | 7.32 | 1.7% | 7.49 | 7.62 | 8.07 |
| Trucks | 8.18 | 7.42 | -11.3% | 9.37 | 9.01 | 8.74 |
by Tom Moeller December 2, 2005
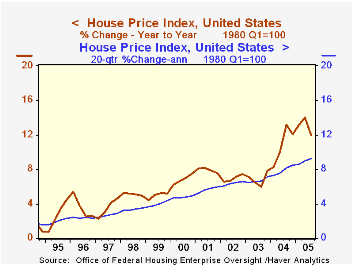
According to the Office of Federal Housing Enterprise Oversight (OFHEO) home prices in the U.S. continued to rise last quarter, but the rate of escalation showed signs of topping out. The 2.9% q/q rise was down from the prior quarter and was down from a 4.7% jump one year ago. As a result the y/y gain slowed to 12.0% from 14.0% in 2Q.
These rates of gain are hardly slow, and given the near record level of home sales, historically low interest rates and rising personal incomes they are widely expected to remain healthy.
Throughout the country, rates of home price appreciation appear to have topped. However, the variance in the rates of growth between regions is high.
During the last year, job cutbacks in the auto industry helped lower the rate of home price appreciation in Michigan to 4.0% and the state's gain has lagged all others. At the other end of the spectrum, demographic trends pushed the rate of home price appreciation in Arizona to the top of the scale at 30.3% y/y.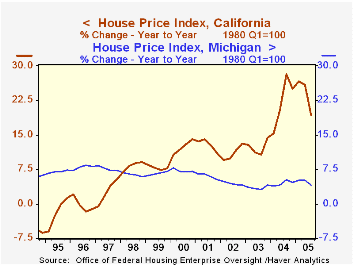
During the last five years, home price appreciation in the District of Columbia has surpassed all others at 118.9% followed closely by California at 112.8%. Indiana with a 20.6% rise is at the bottom of the list during the last five years.
The House Price Indices in this report are weighted indexes based on repeat sales or refinancings using data provided by Fannie Mae or Freddie Mac .
Housing Markets and Demographics from the Federal Reserve Bank of San Francisco can be found here.
The latest report from the Office of Federal Housing Enterprise Oversight (OFHEO) can be found here.
| House Price Index (OFHEO) | 3Q '05 | 2Q '05 | Y/Y | 2004 | 2003 | 2002 |
|---|---|---|---|---|---|---|
| United States | 2.9% | 3.6% | 12.0% | 10.9% | 6.9% | 6.9% |
| California | 4.2% | 5.6% | 19.3% | 22.4% | 12.3% | 11.1% |
| New Jersey | 3.1% | 4.4% | 13.7% | 15.0% | 10.5% | 12.0% |
| Alabama | 2.2% | 2.5% | 8.1% | 4.1% | 4.1% | 3.0% |
| Michigan | 0.9% | 1.0% | 4.0% | 4.4% | 3.5% | 4.4% |
by Carol Stone December 2, 2005
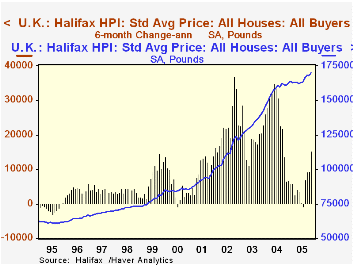
House prices are a major economic indicator for the UK. They are seen by many as a measure of the housing market, and also as a gauge of consumer confidence and spending potential. So after a substantial run-up in those prices from 2001 through the middle of last year, it was of no small concern that they flattened out until a few months ago.
The measure here is the "Halifax House Price Index", a compilation by the country's largest mortgage lender, HBOS plc. It is based on about 15,000 home sales monthly; the data are adjusted for the size and style of home, so that month-to-month comparisons are calculated from like or "standardized" properties. Thus, the index measures only price change, not movements due to differing house or location characteristics.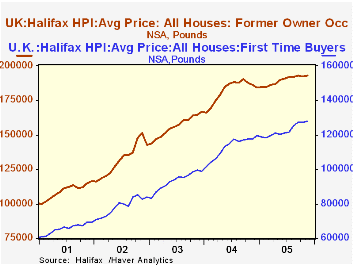
The index began to rise again in June after stagnating for nearly a year. A 1.2% rise in November was the fifth increase in six months, and over the last six months, prices have gone up at a 9.7% annual rate. This compares with a low in the six-month annualized percent change of -0.4% in July. Relative to the enormous increases in 2002 and 2003, the recent pace is not fast, but it clearly is an improvement over the weakness of earlier this year. Accompanying data show that the recovery has been firmer in the existing home segment than in new houses. And as shown in the second graph, prices of the obviously smaller homes purchased by first-time buyers have generally been more vigorous than those bought by previous home owners.
All these data are in Haver's UK database, plus quarterly data for the various regions of the UK. Halifax's researchers publish the data both unadjusted and seasonally adjusted.
| UK House Prices: Halifax data, Seasonally Adjusted | Nov 2005 | Oct 2005 | Sept 2005 | Nov 2004 | 2004 | 2003 | 2002 |
|---|---|---|---|---|---|---|---|
| Annual Average | |||||||
| Price (£ Thous) | 170.1 | 168.1 | 168.2 | 160.7 | 157.0 | 132.2 | 110.9 |
| December/December | |||||||
| % Change* | 1.2 | -0.0 | 1.1 | 5.7 | 14.2 | 17.3 | 23.1 |

Tom Moeller
AuthorMore in Author Profile »Prior to joining Haver Analytics in 2000, Mr. Moeller worked as the Economist at Chancellor Capital Management from 1985 to 1999. There, he developed comprehensive economic forecasts and interpreted economic data for equity and fixed income portfolio managers. Also at Chancellor, Mr. Moeller worked as an equity analyst and was responsible for researching and rating companies in the economically sensitive automobile and housing industries for investment in Chancellor’s equity portfolio. Prior to joining Chancellor, Mr. Moeller was an Economist at Citibank from 1979 to 1984. He also analyzed pricing behavior in the metals industry for the Council on Wage and Price Stability in Washington, D.C. In 1999, Mr. Moeller received the award for most accurate forecast from the Forecasters' Club of New York. From 1990 to 1992 he was President of the New York Association for Business Economists. Mr. Moeller earned an M.B.A. in Finance from Fordham University, where he graduated in 1987. He holds a Bachelor of Arts in Economics from George Washington University.
More Economy in Brief

 Global| Feb 05 2026
Charts of the Week: Balanced Policy, Resilient Data and AI Narratives
by:Andrew Cates

