Global| Dec 02 2005
U.S. Payrolls Up
by:Tom Moeller
|in:Economy in Brief
Summary
In November, non-farm payrolls posted the largest gain since July. The 215,000 increase matched Consensus expectations and followed a 44,000 October rise that was slightly lower than initially reported, but the September figure was [...]
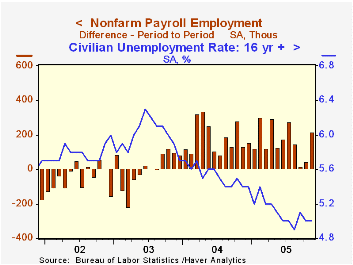
In November, non-farm payrolls posted the largest gain since July. The 215,000 increase matched Consensus expectations and followed a 44,000 October rise that was slightly lower than initially reported, but the September figure was revised to up 17,000 from a previously reported 8,000 drop.
From the household survey the unemployment rate held at 5.0%, as expected. Employment fell 52,000 (+1.6% y/y) after a 214,000 rise in October and the labor force rose 97,000 (1.3% y/y).
Factory sector payrolls increased 11,000 (-0.5% y/y). Together with a 15,000 worker rise in October, the figure marked the first time since early last year that factory payrolls have risen in consecutive months. Some improvement in the breadth across industries of job gains was suggested by the sector's one month diffusion index which rose to 51.8%, its highest level since July of last year.
Construction employment rose 37,000 (4.2% y/y), up a bit from the 28,000 average during the prior three months.
Payrolls in private service producing industries rose 144,000 (1.8% y/y) after a little revised 5,000 worker decline in October. Education & health services jobs increased 36,000 (2.2% y/y) and returned to the earlier pace after an October decline. Retail trade added 8,500 (0.7% y/y) jobs but a larger 29,000 (2.8% y/y) gain was posted by professional & business services. Jobs in financial services rose 13,000 (2.4% y/y) and leisure & hospitality recovered 29,000 (1.6% y/y) after two months of decline.
The gain in average hourly earnings eased to an expected 0.2% after the upwardly revised 0.6% spike in October. Factory sector earnings rose 0.2% (2.5% y/y) but private service sector earnings fell 0.1% (+3.4% y/y).
Today's remarks by Federal Reserve Board Chairman Alan Greenspan on Budget Policy can be found here.
| Employment | Nov | Oct | Y/Y | 2004 | 2003 | 2002 |
|---|---|---|---|---|---|---|
| Payroll Employment | 215,000 | 44,000 | 1.5% | 1.1% | -0.3% | -1.1% |
| Manufacturing | 11,000 | 15,000 | -0.5% | -1.2% | -4.9% | -7.2% |
| Average Weekly Hours | 33.7 | 33.8 | 33.7 (Nov '04) | 33.7 | 33.7 | 33.8 |
| Average Hourly Earnings | 0.2% | 0.6% | 3.2% | 2.1% | 2.7% | 2.9% |
| Unemployment Rate | 5.0% | 5.0% | 5.4% (Nov '04) | 5.5% | 6.0% | 5.8% |

Tom Moeller
AuthorMore in Author Profile »Prior to joining Haver Analytics in 2000, Mr. Moeller worked as the Economist at Chancellor Capital Management from 1985 to 1999. There, he developed comprehensive economic forecasts and interpreted economic data for equity and fixed income portfolio managers. Also at Chancellor, Mr. Moeller worked as an equity analyst and was responsible for researching and rating companies in the economically sensitive automobile and housing industries for investment in Chancellor’s equity portfolio. Prior to joining Chancellor, Mr. Moeller was an Economist at Citibank from 1979 to 1984. He also analyzed pricing behavior in the metals industry for the Council on Wage and Price Stability in Washington, D.C. In 1999, Mr. Moeller received the award for most accurate forecast from the Forecasters' Club of New York. From 1990 to 1992 he was President of the New York Association for Business Economists. Mr. Moeller earned an M.B.A. in Finance from Fordham University, where he graduated in 1987. He holds a Bachelor of Arts in Economics from George Washington University.