 Global| Aug 27 2020
U.S. Pending Home Sales Advance Slows, but Still Strong
Summary
• Pending home sales are reach highest level since October 2005. • Improvement continues but more moderately in all 4 regions. • Smallest increase in South, but it sets new record high. After substantial gains in May and June, pending [...]
• Pending home sales are reach highest level since October 2005.
• Improvement continues but more moderately in all 4 regions.
• Smallest increase in South, but it sets new record high.
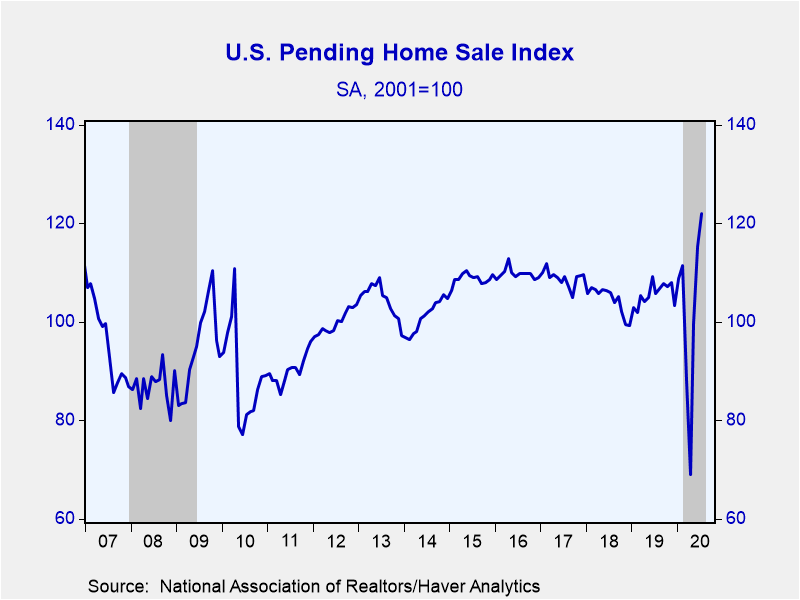
After substantial gains in May and June, pending home sales increased by a more moderate amount in July. According to data compiled by the National Association of Realtors, their index was up 5.9% in July from June at 122.1 (2001=100 and +15.5% y/y). From a recent trough in the index of 69.0 in April, these home sales increased 44.3% in May and 15.8% in June. The July volume was the largest amount since October 2005. The home sales were supported by the continuing decline in mortgage rates during July, which reached a record low of 3.06% for the Mortgage Bankers Association contract rate during the week of August 7.
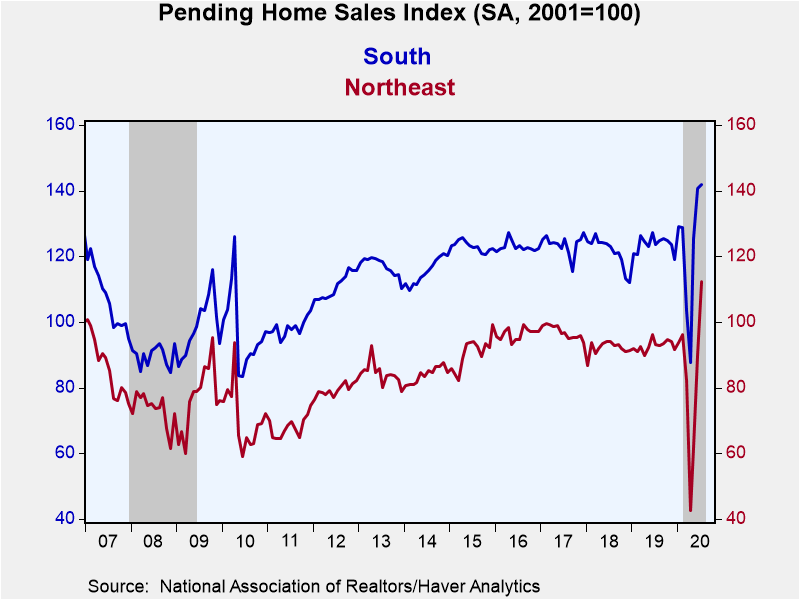
Pending home sales rose again in all the major regions of the country, although the gains were noticeably smaller than in June and just fractions of their May surges. The largest increase was in the Northeast, 25.2% (20.6% y/) to 112.3, which is the largest amount for that region since April 2005. July sales were up 6.8% in the West to 106.4 (+13.2% y/y) and 3.3% in the Midwest to 114.6 (15.4% y/y); the latter is the highest since November 2005. Sales did increase in the South, but just barely, 0.9%, to 142.0 (+14.9% y/y), although that is the highest ever for that region
The pending home sales index measures sales at the time the contract for an existing home is signed, analogous to the Census Bureau's new home sales data. In contrast, the National Association of Realtors' existing home sales data are recorded when the sale is closed. In developing the pending home sales index, the NAR found that the level of monthly sales contract activity anticipates the level of closed existing home sales in the following two months. The series dates back to 2001, and the data are available in Haver's PREALTOR database. Mortgage interest rates from the Mortgage Bankers Association can be found in the SURVEYW database.
| Pending Home Sales (SA, % chg) | Jul | Jun | May | Jul Y/Y % | 2019 | 2018 | 2017 |
|---|---|---|---|---|---|---|---|
| Total | 5.9 | 15.8 | 44.3 | 15.5 | 1.1 | -4.1 | -0.8 |
| Northeast | 25.2 | 45.1 | 45.1 | 20.6 | 0.8 | -5.0 | 0.6 |
| Midwest | 3.3 | 12.2 | 37.2 | 15.4 | -0.3 | -4.6 | -2.5 |
| South | 0.9 | 12.3 | 43.2 | 14.9 | 1.8 | -1.9 | 0.6 |
| West | 6.8 | 11.7 | 56.2 | 13.2 | 1.3 | -7.3 | -2.5 |
Carol Stone, CBE
AuthorMore in Author Profile »Carol Stone, CBE came to Haver Analytics in 2003 following more than 35 years as a financial market economist at major Wall Street financial institutions, most especially Merrill Lynch and Nomura Securities. She had broad experience in analysis and forecasting of flow-of-funds accounts, the federal budget and Federal Reserve operations. At Nomura Securities, among other duties, she developed various indicator forecasting tools and edited a daily global publication produced in London and New York for readers in Tokyo. At Haver Analytics, Carol was a member of the Research Department, aiding database managers with research and documentation efforts, as well as posting commentary on select economic reports. In addition, she conducted Ways-of-the-World, a blog on economic issues for an Episcopal-Church-affiliated website, The Geranium Farm. During her career, Carol served as an officer of the Money Marketeers and the Downtown Economists Club. She had a PhD from NYU's Stern School of Business. She lived in Brooklyn, New York, and had a weekend home on Long Island.
More Economy in Brief
 Global| Feb 05 2026
Charts of the Week: Balanced Policy, Resilient Data and AI Narratives
by:Andrew Cates


