 Global| Oct 01 2009
U.S. Pending Home Sales Climb Another 6.4% in August
Summary
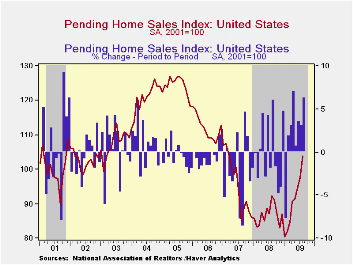
Housing demand continues to improve. The National Association of Realtors (NAR) reported that during August, pending home sales increased 6.4%, notably stronger than June's 3.6% and July's 3.2% gains. NAR's index stood at 103.8, the [...]
 Housing
demand continues to improve. The National Association of Realtors (NAR)
reported that during August, pending home sales increased 6.4%, notably
stronger than June's 3.6% and July's 3.2% gains. NAR's index
stood at 103.8, the highest since March 2007; the index base is
2001=100.
In this report, all four regions of the
country participated in the firming sales pattern. The West
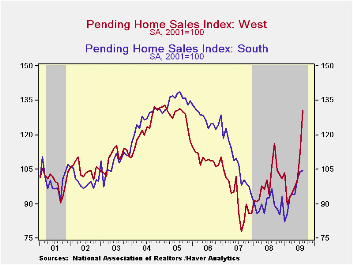
led again, with a whopping 16.0% jump. This is a
monthly rate; you can annualize it, if you like, and see a really
eye-popping figure. The sales index there was 130.5; its
all-time high in the West is 133.0 in February 2005. This
upturn in sales has been helped by weak house prices, but as noted
elsewhere on these pages recently, these prices have started to firm;
while there are no price data with this report, NAR's tally of sales
closed in August showed an outright increase in prices in the West of
1.3%; since an apparent trough in April, these prices have risen a
total of 8.6%.
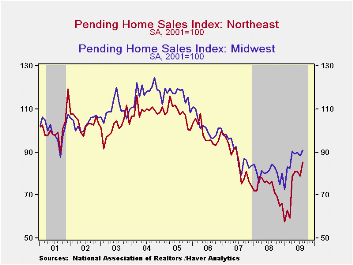
Elsewhere, sales advanced 8.2% in the Northeast, and at 85.3, this index is up 47.6% since the low there in January. In the Midwest, sales gained 3.1% in August, and they are 25.1% above their low, also in January. Sales in the South just barely edged higher, 0.8%, but they have risen more in prior months, so that they are now 27.3% above their January trough.
 These
home sales figures are analogous to the new home sales data from the
Commerce Department in that they measure existing home sales when the
sales contract is signed, not at the time the sale is closed. The
series dates back to 2001.
The pending home sales data are available in Haver's PREALTOR database. The number of homes on the market and prices are in the REALTOR database.
| Pending Home Sales (2001=100) | August | July | June | Y/Y | 2008 | 2007 | 2006 |
|---|---|---|---|---|---|---|---|
| Total | 103.8 | 97.6 | 94.6 | 12.3% | 86.8 | 95.8 | 112.1 |
| Northeast | 85.3 | 78.8 | 81.2 | 11.9 | 73.1 | 85.9 | 98.9 |
| Midwest | 90.8 | 88.1 | 89.9 | 7.6 | 80.6 | 89.5 | 101.9 |
| South | 104.6 | 103.8 | 100.7 | 8.3 | 89.6 | 107.3 | 127.2 |
| West | 130.5 | 112.5 | 100.4 | 22.3 | 99.5 | 92.3 | 109.6 |
Carol Stone, CBE
AuthorMore in Author Profile »Carol Stone, CBE came to Haver Analytics in 2003 following more than 35 years as a financial market economist at major Wall Street financial institutions, most especially Merrill Lynch and Nomura Securities. She had broad experience in analysis and forecasting of flow-of-funds accounts, the federal budget and Federal Reserve operations. At Nomura Securities, among other duties, she developed various indicator forecasting tools and edited a daily global publication produced in London and New York for readers in Tokyo. At Haver Analytics, Carol was a member of the Research Department, aiding database managers with research and documentation efforts, as well as posting commentary on select economic reports. In addition, she conducted Ways-of-the-World, a blog on economic issues for an Episcopal-Church-affiliated website, The Geranium Farm. During her career, Carol served as an officer of the Money Marketeers and the Downtown Economists Club. She had a PhD from NYU's Stern School of Business. She lived in Brooklyn, New York, and had a weekend home on Long Island.
More Economy in Brief
 Global| Feb 05 2026
Charts of the Week: Balanced Policy, Resilient Data and AI Narratives
by:Andrew Cates


