 Global| Sep 26 2019
U.S. Pending Home Sales Rebound in August
by:Sandy Batten
|in:Economy in Brief
Summary
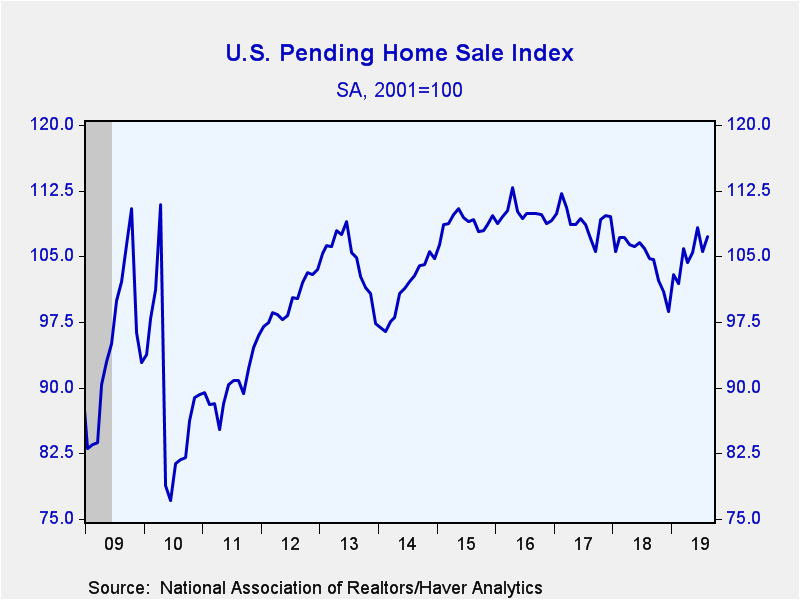
The National Association of Realtors (NAR) reported that U.S. pending home sales rose a larger-than-expected 1.6% m/m in August (+2.5% y/y) following a 2.5% m/m decline in July. Meanwhile, mortgage rates continued to decline. The [...]
The National Association of Realtors (NAR) reported that U.S. pending home sales rose a larger-than-expected 1.6% m/m in August (+2.5% y/y) following a 2.5% m/m decline in July. Meanwhile, mortgage rates continued to decline. The effective rate on a 15-year fixed-rate mortgage fell to 3.40% in August from 3.54% in July, the ninth consecutive monthly decline and the lowest level since November 2016. This declining trend in interest rates has had a positive impact on housing activity. Pending sales are up 8.7% since the four-and-a-half year low reached last December.
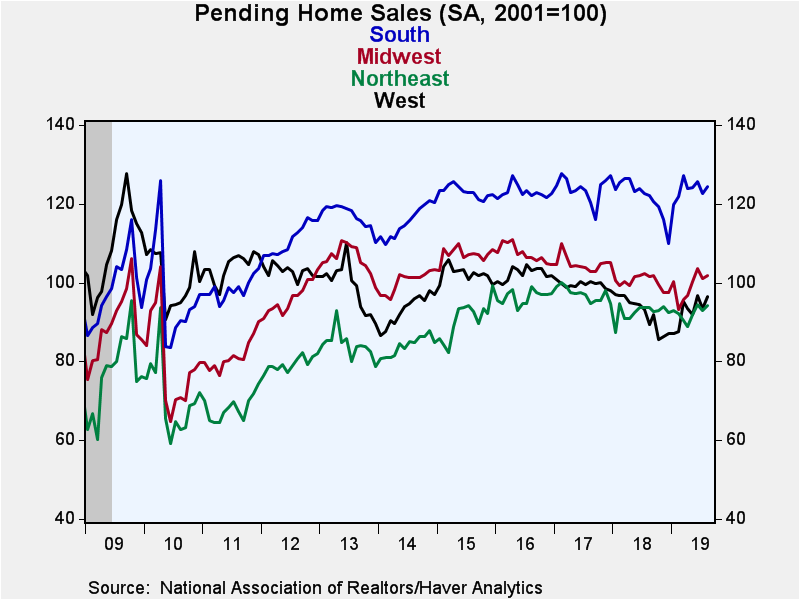
The August increase was spread across all major regions with each region experiencing both a monthly and an annual increase. The gains were particularly strong in the West where pending sales increased 3.1% m/m (8.0% y/y) in August. Pending sales rose 1.4% m/m (0.7% y/y) in the Northeast, edged up 0.6% m/m (0.2% y/y) in the Midwest and rose 1.4% m/m (1.8% y/y) in the South.
The pending home sales index measures sales at the time the contract for the sale of an existing home is signed, analogous to the Census Bureau's new home sales data. In contrast, the National Association of Realtors' existing home sales data are recorded when the sale is closed, which is a month or two later. Accordingly, in developing the pending home sales index, the NAR found that the level of monthly sales contract activity precedes the level of closed existing home sales by one to two months. The series dates back to 2001, and the data are available in Haver's PREALTOR database. Mortgage interest rates from the Mortgage Bankers Association can be found in the SURVEYW database.
| Pending Home Sales (SA, 2001=100) | Aug | Jul | Jun | Aug Y/Y % | 2018 | 2017 | 2016 |
|---|---|---|---|---|---|---|---|
| Total | 107.3 | 105.6 | 108.3 | 2.5 | 104.7 | 109.1 | 109.8 |
| Northeast | 94.3 | 93.0 | 94.5 | 0.7 | 92.4 | 97.1 | 96.4 |
| Midwest | 101.7 | 101.0 | 103.6 | 0.2 | 100.2 | 104.9 | 107.4 |
| South | 124.4 | 122.7 | 125.7 | 1.8 | 121.6 | 123.9 | 123.0 |
| West | 96.4 | 93.5 | 96.8 | 8.0 | 92.3 | 99.5 | 102.3 |
Sandy Batten
AuthorMore in Author Profile »Sandy Batten has more than 30 years of experience analyzing industrial economies and financial markets and a wide range of experience across the financial services sector, government, and academia. Before joining Haver Analytics, Sandy was a Vice President and Senior Economist at Citibank; Senior Credit Market Analyst at CDC Investment Management, Managing Director at Bear Stearns, and Executive Director at JPMorgan. In 2008, Sandy was named the most accurate US forecaster by the National Association for Business Economics. He is a member of the New York Forecasters Club, NABE, and the American Economic Association. Prior to his time in the financial services sector, Sandy was a Research Officer at the Federal Reserve Bank of St. Louis, Senior Staff Economist on the President’s Council of Economic Advisors, Deputy Assistant Secretary for Economic Policy at the US Treasury, and Economist at the International Monetary Fund. Sandy has taught economics at St. Louis University, Denison University, and Muskingun College. He has published numerous peer-reviewed articles in a wide range of academic publications. He has a B.A. in economics from the University of Richmond and a M.A. and Ph.D. in economics from The Ohio State University.
More Economy in Brief
 Global| Feb 05 2026
Charts of the Week: Balanced Policy, Resilient Data and AI Narratives
by:Andrew Cates


