 Global| Oct 29 2019
U.S. Pending Home Sales Strengthen
by:Tom Moeller
|in:Economy in Brief
Summary
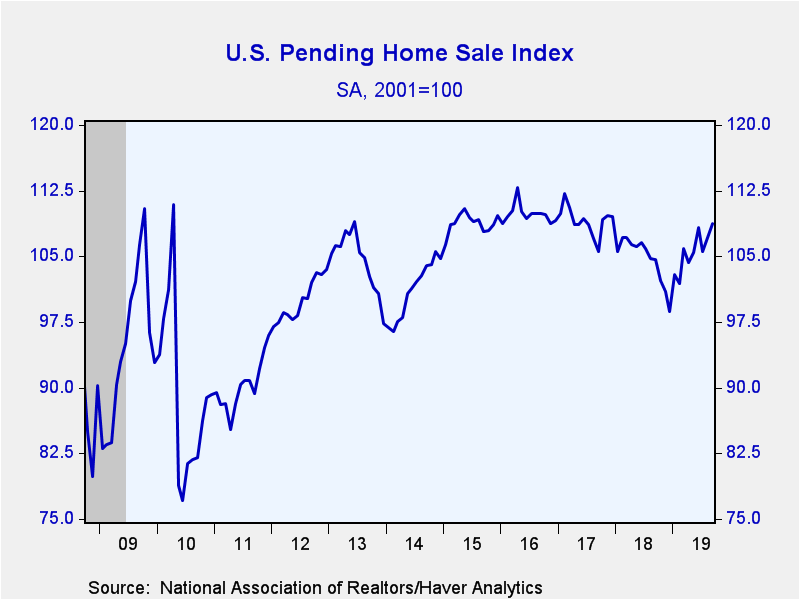
The National Association of Realtors (NAR) reported that U.S. pending home sales rose 1.5% (3.9% y/y) during September following a 1.4% August increase. The index level of sales increased to 108.7, the highest level since December [...]
The National Association of Realtors (NAR) reported that U.S. pending home sales rose 1.5% (3.9% y/y) during September following a 1.4% August increase. The index level of sales increased to 108.7, the highest level since December 2017.
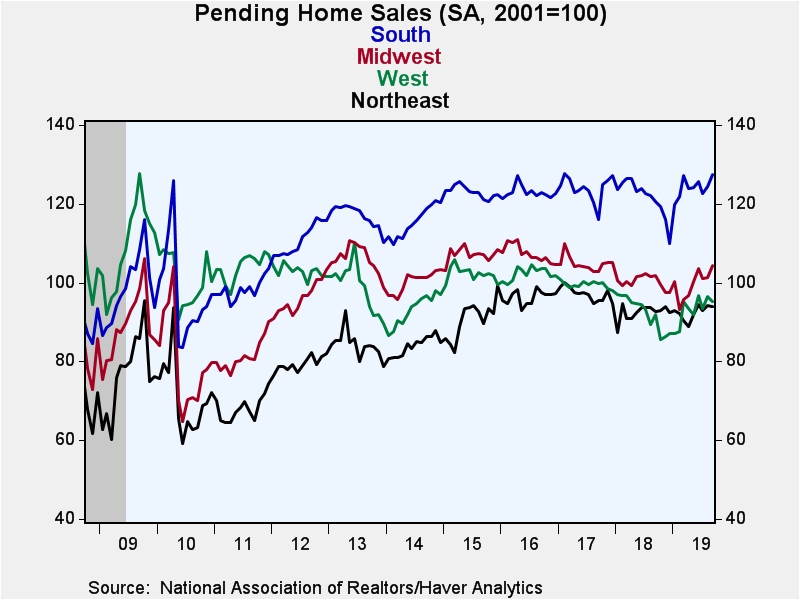
Sales were mixed last month across the country. In the Midwest sales increased 3.1% (2.7% y/y) last month after a 0.2% rise. In the South sales rose 2.6% (5.7% y/y) following a 1.3% gain. Working 1.3% lower (+3.4% y/y) were sales in the West after a 3.1% rise. In the Northeast sales eased 0.4% (+1.3% y/y) following a 1.4% increase.
The pending home sales index measures sales at the time the contract for the sale of an existing home is signed, analogous to the Census Bureau's new home sales data. In contrast, the National Association of Realtors' existing home sales data are recorded when the sale is closed, which is a month or two later. Accordingly, in developing the pending home sales index, the NAR found that the level of monthly sales contract activity precedes the level of closed existing home sales by one to two months. The series dates back to 2001, and the data are available in Haver's PREALTOR database. Mortgage interest rates from the Mortgage Bankers Association can be found in the SURVEYW database.
| Pending Home Sales (SA, 2001=100) | Sep | Aug | Jul | Sep Y/Y % | 2018 | 2017 | 2016 |
|---|---|---|---|---|---|---|---|
| Total | 108.7 | 107.1 | 105.6 | 3.9 | 104.7 | 109.1 | 109.8 |
| Northeast | 93.9 | 94.3 | 93.0 | 1.3 | 92.4 | 97.1 | 96.4 |
| Midwest | 104.4 | 101.3 | 101.1 | 2.7 | 100.2 | 104.9 | 107.4 |
| South | 127.5 | 124.3 | 122.7 | 5.7 | 121.6 | 123.9 | 123.0 |
| West | 95.1 | 96.4 | 93.5 | 3.4 | 92.3 | 99.5 | 102.3 |
Tom Moeller
AuthorMore in Author Profile »Prior to joining Haver Analytics in 2000, Mr. Moeller worked as the Economist at Chancellor Capital Management from 1985 to 1999. There, he developed comprehensive economic forecasts and interpreted economic data for equity and fixed income portfolio managers. Also at Chancellor, Mr. Moeller worked as an equity analyst and was responsible for researching and rating companies in the economically sensitive automobile and housing industries for investment in Chancellor’s equity portfolio. Prior to joining Chancellor, Mr. Moeller was an Economist at Citibank from 1979 to 1984. He also analyzed pricing behavior in the metals industry for the Council on Wage and Price Stability in Washington, D.C. In 1999, Mr. Moeller received the award for most accurate forecast from the Forecasters' Club of New York. From 1990 to 1992 he was President of the New York Association for Business Economists. Mr. Moeller earned an M.B.A. in Finance from Fordham University, where he graduated in 1987. He holds a Bachelor of Arts in Economics from George Washington University.
More Economy in Brief
 Global| Feb 05 2026
Charts of the Week: Balanced Policy, Resilient Data and AI Narratives
by:Andrew Cates


