 Global| Aug 31 2007
U.S. Personal Income Gains 0.5% in July; Spending Recovers from June Weakness
Summary
Personal income rose 0.5% in July, slightly firmer than June's 0.4%. Consensus forecasts had pointed to a 0.3% July rise. This monthly increase put the 12-month change at 6.6%. The PCE chain price index rose just 0.1% during July, [...]
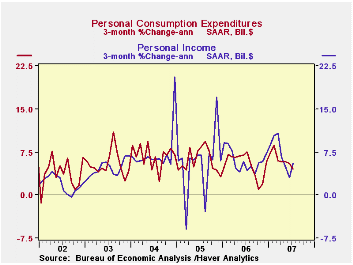
Personal income rose 0.5% in July, slightly firmer than June's 0.4%. Consensus forecasts had pointed to a 0.3% July rise. This monthly increase put the 12-month change at 6.6%.
The PCE chain price index rose just 0.1% during July, following June's 0.2%, which was a shade more than originally reported. The core PCE price measure also rose 0.1% and it too was revised to 0.2% from 0.1% in June. The total price index is up a mere 2.1% on the year, and the core rate 1.9%. annualized, the gain in core prices came in at 1.6% over the last three months. The increase in the total PCE price index was 2.9% during the same three months (AR), down from the 3.7% three-month-gain in June and 4.9% through May.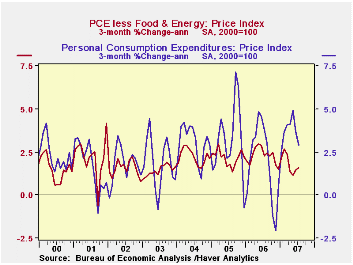
Wages & salaries increased 0.5% (7.2% y/y) in July and factory sector wages rose just 0.2% (6.6% y/y) after a 0.5% June rise.Wage & salary income in service-producing industries rose 0.6% (8.1% y/y) after a 0.5% increase in June while pay in the government sector rose 0.2% (4.5% y/y).
Interest income grew 0.7%, picking up to 2.7% y/y, while dividend income rose 1.0% (14.8% y/y), about the same as during the prior six months.
Personal current taxes increased 0.3% (11.0% y/y). That left disposable personal income to grow 0.6% (6.0% y/y) after a 0.4% June gain. Real disposable personal income thus rose 0.5% last month, extending an improvement from a 0.1% decline during May and a 0.2% rise in June.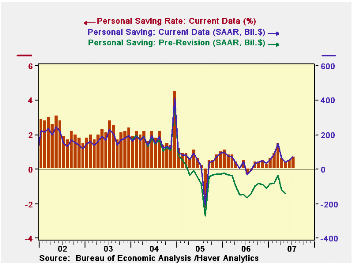
Personal consumption expenditures increased just 0.4% in July following a 0.2% gain during June. Expectations were for 0.3% rise. Durable goods purchases recovered somewhat, with a 0.3% increase after June's 1.6% fall. Motor vehicle outlays rose 0.5%, after their 3.7% drop in June, although they were 3.0% below July 2006. Spending on furniture & other household equipment was up 0.5%, and June's decline, originally 1.0%, was revised to 0.3%. Spending on gasoline continued to decline, in July by 0.6%. The year/year change is now -3.9%, reflecting this July decline and the surge in the corresponding month last year. Spending on apparel turned up by 1.0% after June's 0.8% fall; year/year growth thus improved to 4.2% from June's 3.7%. Outlays in the big services sector expanded 0.4% following June's 0.6% advance and were 5.8% above a year ago.
The personal saving rate was 0.7% in July. This is not "high", but signifies a better performance than we had been aware of. After the July revisions put the saving rate back up into positive territory, now it seems to show negative only under special circumstances, just as Hurricane Katrina and last summer's striking surge in gasoline prices. Most of the time, people seem to be able to fit their spending to their income.
| Disposition of Personal Income | July | June | Y/Y | 2006 | 2005 | 2004 |
|---|---|---|---|---|---|---|
| Personal Income | 0.5% | 0.4% | 6.6% | 6.6% | 5.9% | 6.2% |
| Personal Consumption | 0.4% | 0.2% | 4.7% | 5.9% | 6.2% | 6.4% |
| Saving Rate | 0.7% | 0.5% | -0.3% (July 06) | 0.4% | 0.5% | 2.1% |
| PCE Chain Price Index | 0.1% | 0.2% | 2.1% | 2.8% | 2.9% | 2.6% |
| Less food & energy | 0.1% | 0.1% | 1.9% | 2.2% | 2.2% | 2.1% |
by Robert Brusca August 31, 2007
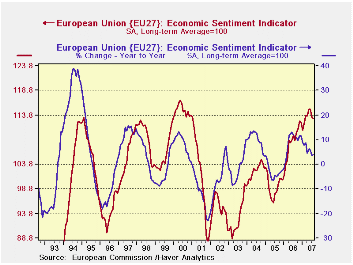
The accompanying chart is the paradox of Europe. Its sentiment index is very high yet there is already a clear loss in momentum. Historically, breaks in momentum have led to significant slow downs. So far this one has been different.
The main EU measures also show some subtle losses in momentum. This softening is reinforced by declines in sentiment indexes across the major EU members. Only France (missing its observations for August) has showed continued increases in sentiment up until now. The retail sector is relatively the strongest with its highest reading to date in August. Financial turmoil appears to have not phased it. The industrial sector is still relatively strong posting its eighth highest reading. But consumer sentiment has slipped and is in its 82nd percentile far from the 90-plus readings for retail and industry. Across the main EMU/EU countries they stand in the 60th to 80th percentiles of their ranges. This means that for EU overall it is the smaller countries that are doing even better. It is reasonable to wonder if they are simply lagging in their slowdown. There is little evidence that the recent turmoil in markets has had an impact since consumer confidence is where we would expect to see it, and that gauge did slip this month, but has been slipping in any event.
| EU | Aug-07 | Jul-07 | Jun-07 | May-07 | Percentile | Rank | Max | Min | Range | Mean | R-SQ w/Confid |
| Overall | 113.2 | 113.3 | 115 | 115 | 91.5 | 20 | 117 | 74 | 43 | 100 | 1.00 |
| Industrial | 5 | 5 | 7 | 6 | 94.1 | 8 | 7 | -27 | 34 | -7 | 0.89 |
| Consumer Confidence | -3 | -2 | -2 | -1 | 82.8 | 27 | 2 | -27 | 29 | -10 | 0.82 |
| Retail | 6 | 5 | 5 | 5 | 100.0 | 1 | 6 | -21 | 27 | -6 | 0.46 |
| Construction | 0 | 0 | 1 | 1 | 93.3 | 13 | 3 | -42 | 45 | -18 | 0.43 |
| Services | 21 | 20 | 21 | 23 | 71.1 | 55 | 32 | -6 | 38 | 17 | 0.80 |
| % m/m | Based on Level | Level | |||||||||
| EMU | -0.9% | -0.6% | -0.4% | 1.0% | 83.1 | 39 | 117 | 74 | 44 | 100 | 0.94 |
| Germany | -0.9% | -0.5% | -0.4% | 0.8% | 73.7 | 26 | 121 | 79 | 42 | 100 | 0.61 |
| France | #N/A | 0.6% | 0.0% | 3.0% | #N/A | #N/A | #N/A | #N/A | #N/A | #N/A | #N/A |
| Italy | -3.0% | -0.9% | -1.3% | -1.4% | 63.5 | 84 | 121 | 72 | 49 | 100 | 0.79 |
| Spain | 1.1% | -0.9% | 1.2% | -1.2% | 62.3 | 134 | 118 | 67 | 50 | 100 | 0.67 |
| Memo: UK | 4.5% | -5.7% | 1.6% | 3.4% | 90.3 | 8 | 119 | 69 | 50 | 100 | 0.38 |
| Since 1990 except Services (Oct 1996) 208-Count | Services: 126-Count | ||||||||||
| Sentiment is an index, sector readings are net balance diffusion measures | |||||||||||
by Robert Brusca August 31, 2007
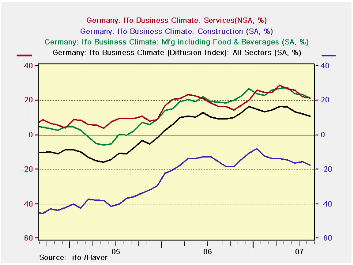
In the German IFO framework the biggest slippage seems to be in orders on hand, month-to-month demand, and business expectations. These measures have dropped into the 60th to 70th percentile ranges of their respective histories. These are still firm readings but not so strong. One continuing feature of interest in this report is the strength of foreign orders on hand. Foreign orders are still near their peak reading in the 98th percentile of their range. Despite this the current situation is still evaluated as strengthening and is in the 95th percentile of its range.
The IFO’s three month outlook survey is also mixed. Only order expectations for retailers are weakening and they have been crumbling steadily and rapidly for months. Employment expectations are guarded.
The IFO’s diffusion measures by sector show a sharp drop for wholesalers with conditions eroding across most sectors. Construction and retail continue to post net negative signals and they too are fading.
| Percent: Yr/Yr | INDEX NUMBERS | ||||||||
| Aug-07 | Jul-07 | Jun-07 | May-07 | Apr-07 | CURRENT | Average | Curr/Avg | Percentile | |
| Biz Climate | 0.7% | 0.8% | 0.2% | 2.8% | 2.6% | 105.8 | 95.7 | 110.6% | 87.7% |
| Current Situation | 2.5% | 2.4% | 1.7% | 4.7% | 6.3% | 111.5 | 94.8 | 117.7% | 88.2% |
| Biz Expectations: Next 6-Mos | -1.2% | -0.9% | -1.2% | 1.0% | -1.0% | 100.4 | 96.7 | 103.9% | 76.5% |
| Aug-07 | Jul-07 | Jun-07 | May-07 | Apr-07 | CURRENT | Average | Curr/Avg | Percentile | |
| Current Situation | |||||||||
| MFG | 4.4% | 4.5% | 4.4% | 6.7% | 7.6% | 111.3 | 92.2 | 120.7% | 95.3% |
| Biz Expectations: Next 6-Mos | |||||||||
| MFG | -1.9% | -0.4% | -2.8% | 0.9% | -1.4% | 99.1 | 96.4 | 102.8% | 73.1% |
| Activity (m/m) | |||||||||
| MFG | 1.0% | -1.9% | -3.7% | 2.0% | -0.5% | 104.7 | 96.9 | 108.0% | 85.4% |
| Demand M/M | |||||||||
| MFG | -2.8% | -3.3% | -7.0% | 0.5% | -3.7% | 99.3 | 97.1 | 102.3% | 62.2% |
| Orders on hand | |||||||||
| MFG | -2.4% | -2.7% | -3.6% | -0.9% | -3.0% | 102.2 | 96.4 | 106.0% | 72.7% |
| Foreign orders on hand | |||||||||
| MFG | 2.5% | 1.9% | 2.0% | 2.5% | 1.9% | 112.1 | 94.3 | 118.8% | 98.1% |
| Yr/Yr percentage changes in underlying Indices | |||||||||
| IFO outlook for 3-Months ahead | |||||||||
| 3-Mos ahead | Percent: Yr/Yr | INDEX NUMBERS | |||||||
| Expected Activity | Aug-07 | Jul-07 | Jun-07 | May-07 | Apr-07 | CURRENT | Average | Curr/Avg | Percentile |
| MFG | 2.5% | 1.0% | 3.4% | 0.5% | 0.7% | 102.5 | 96.7 | 106.0% | 91.5% |
| Orders expectations | |||||||||
| Retail Orders Expectations | -1.1% | -11.6% | -10.9% | -4.6% | -10.9% | -10.5 | -17.5 | 59.9% | 72.9% |
| Wholesale | 0.8% | 7.1% | 5.7% | 15.7% | 15.0% | 7.8 | -14.0 | -55.8% | 84.5% |
| Export Biz Expectations | |||||||||
| MFG | 0.9% | 0.0% | 0.5% | -0.5% | -1.1% | 102.8 | 98.4 | 104.5% | 85.6% |
| Employment Expectations | |||||||||
| MFG | 4.1% | 7.4% | 8.4% | 7.5% | 6.4% | 105.0 | 96.0 | 109.4% | 57.1% |
Carol Stone, CBE
AuthorMore in Author Profile »Carol Stone, CBE came to Haver Analytics in 2003 following more than 35 years as a financial market economist at major Wall Street financial institutions, most especially Merrill Lynch and Nomura Securities. She had broad experience in analysis and forecasting of flow-of-funds accounts, the federal budget and Federal Reserve operations. At Nomura Securities, among other duties, she developed various indicator forecasting tools and edited a daily global publication produced in London and New York for readers in Tokyo. At Haver Analytics, Carol was a member of the Research Department, aiding database managers with research and documentation efforts, as well as posting commentary on select economic reports. In addition, she conducted Ways-of-the-World, a blog on economic issues for an Episcopal-Church-affiliated website, The Geranium Farm. During her career, Carol served as an officer of the Money Marketeers and the Downtown Economists Club. She had a PhD from NYU's Stern School of Business. She lived in Brooklyn, New York, and had a weekend home on Long Island.
More Economy in Brief

 Global| Feb 05 2026
Charts of the Week: Balanced Policy, Resilient Data and AI Narratives
by:Andrew Cates

