 Global| Dec 01 2005
U.S. Personal Income Lifted By Strong Wage Gain
by:Tom Moeller
|in:Economy in Brief
Summary
A strong 0.6% gain in wage & salary disbursements raised U.S. personal income by 0.4% in October. The increase in wages offset declines in proprietors' and rental income while the latest rise in total income followed an unrevised 1.7% [...]
A strong 0.6% gain in wage & salary disbursements raised U.S. personal income by 0.4% in October. The increase in wages offset declines in proprietors' and rental income while the latest rise in total income followed an unrevised 1.7% surge in September, though income in August was revised down slightly. Consensus expectations had been for 0.5% income growth in October.
The effects of Hurricanes Katrina, Rita & Wilma are reflected in the last three months' income figures. A description of these effects can be found here.
Wages & salary income doubled the previous months' rise and increased 0.6% (5.0% y/y) on the strength of a 1.4% (3.2% y/y) surge in factory sector wages. Service sector wages rose 0.6% (5.5% y/y) after an upwardly revised 0.5% September increase and government wages rose 0.2% (3.4% y/y).
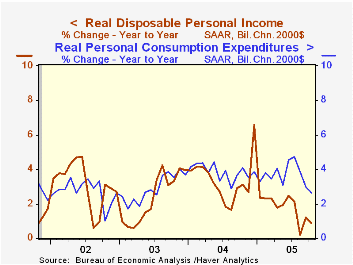
Disposable personal income rose 0.3% (4.2% y/y) following the unrevised 1.9% jump in September. Adjusted for the 0.1% rise in prices, take home pay rose 0.2% (0.9% y/y).
The PCE chain price index rose a modest 0.1% in October, held back by lower gasoline prices which caused nondurable prices to fall 0.4% (+5.1% y/y). Less food & energy the modest 0.1% increase additionally reflected lower light vehicle prices. Services price rose 0.4% (3.2% y/y) for the second month.
Personal consumption expenditures rose an expected, modest 0.2%. Light vehicle sales fell for the third consecutive month and lowered spending on durables by 2.5% (-2.0% y/y). Nondurables outlays rose 0.6% (9.1% y/y) but adjusted for the y/y gain in prices spending on nondurables rose a lesser 3.8% y/y. Services spending rose 0.5% (6.2% y/y).
| Disposition of Personal Income | Oct | Sept | Y/Y | 2004 | 2003 | 2002 |
|---|---|---|---|---|---|---|
| Personal Income | 0.4% | 1.7% | 5.3% | 5.9% | 3.2% | 1.8% |
| Personal Consumption | 0.2% | 0.5% | 6.1% | 6.5% | 4.9% | 4.2% |
| Savings Rate | -0.7% | -0.8% | 1.1% (Oct '04) | 1.7% | 2.1% | 2.4% |
| PCE Chain Price Index | 0.1% | 0.9% | 3.3% | 2.6% | 1.9% | 1.4% |
| Less food & energy | 0.1% | 0.2% | 1.8% | 2.0% | 1.3% | 1.8% |
by Tom Moeller December 1, 2005
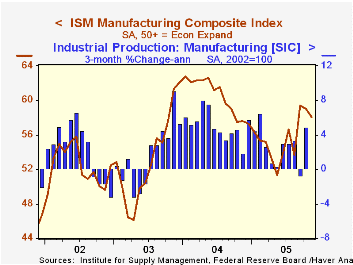
The Institute of Supply Management (ISM) reported that the November Composite Index of activity in the manufacturing sector fell one point to 58.1. The decline about matched Consensus expectations and the average of the last three months, at 58.9, was the highest in over a year.
During the last twenty years there has been a 64% correlation between the level of the Composite Index and the three month growth in factory sector industrial production.
As during October, three of the index's five components fell last month. New orders fell another 1.9 points but remained well up from the May low. The moderate decline in production also left the level up from the Spring low and the pace of supplier deliveries quickened to the fastest pace since August .
Job creation in the factory sector improved to the best level since February with a 1.6 point gain. During the last twenty years there has been a 67% correlation between the level of the ISM Employment Index and the three month growth in factory sector employment.
Pricing power in the factory sector eased to the lowest level since August with a ten point m/m decline.
| ISM Manufacturing Survey | Nov | Oct | Nov '04 | 2004 | 2003 | 2002 |
|---|---|---|---|---|---|---|
| Composite Index | 58.1 | 59.1 | 57.6 | 60.5 | 53.3 | 52.4 |
| New Orders Index | 59.8 | 61.7 | 60.7 | 63.5 | 57.9 | 56.5 |
| Prices Paid Index (NSA) | 74.0 | 84.0 | 74.0 | 79.8 | 59.6 | 57.6 |
by Tom Moeller December 1, 2005
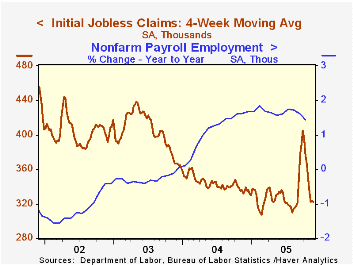
Initial claims for jobless insurance reversed about half of the prior week's rise and fell 17,000 to 320,000 during Thanksgiving week. Consensus expectations had been for 323,000 claims.
Hurricane related claims dropped back to 10,000 and brought the total of the three storms during the last thirteen weeks to 592,000.
The four-week moving average of initial claims fell slightly to 322,500 (-3.5% y/y).
Continuing claims for unemployment insurance fell 24,000 following a downwardly revised 26,000 gain the prior week.
The insured rate of unemployment held at 2.2% for the tenth consecutive week.
| Unemployment Insurance (000s) | 11/26/05 | 11/19/05 | Y/Y | 2004 | 2003 | 2002 |
|---|---|---|---|---|---|---|
| Initial Claims | 320 | 337 | -7.5% | 343 | 402 | 404 |
| Continuing Claims | -- | 2,767 | 1.1% | 2,926 | 3,531 | 3,570 |
by Tom Moeller December 1, 2005
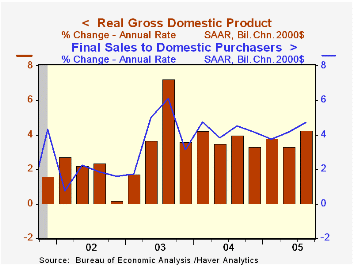
Domestic demand growth of 4.7% versus the initial report of a 4.1% rise was due to an upward revision to real PCE to 4.3% (3.9% y/y) growth.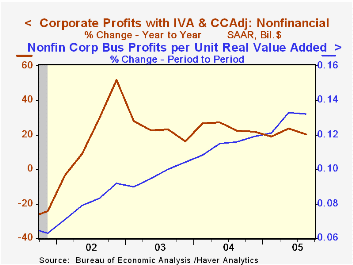
Strength in business fixed investment also was increased to 8.7% (8.4% y/y) and residential investment growth was doubled to 8.4% (7.5% y/y).
Inventory accumulation continued to have a negative effect on GDP growth but was little revised at -0.4%.
The foreign trade deficit subtracted rather than added to GDP growth since imports grew 2.1% (5.1% y/y) rather than declining as initially estimated.
The chain price index rose about as initially estimated.
| Chained 2000$, % AR | 3Q '05 (Revised) | 3Q '05 (Advance) | 2Q '05 | Y/Y | 2004 | 2003 | 2002 |
|---|---|---|---|---|---|---|---|
| GDP | 4.3% | 3.8% | 3.3% | 3.7% | 4.2% | 2.7% | 1.6% |
| Inventory Effect | -0.4% | -0.6% | -2.1% | -0.6% | 0.3% | 0.0% | 0.4% |
| Final Sales | 4.7% | 4.4% | 5.6% | 4.3% | 3.9% | 2.7% | 1.2% |
| Foreign Trade Effect | -0.3% | 0.1% | 1.1% | 0.2% | -0.5% | -0.3% | -0.6% |
| Domestic Final Demand | 4.7% | 4.1% | 4.2% | 4.2% | 4.4% | 3.0% | 1.8% |
| Chained GDP Price Index | 3.0% | 3.1% | 2.6% | 2.9% | 2.6% | 2.0% | 1.7% |
by Tom Moeller December 1, 2005
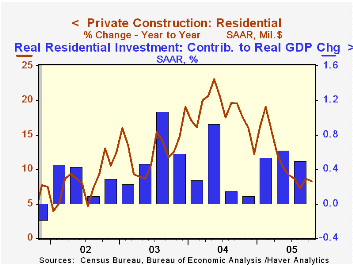
The value of construction put in place rose 0.7% in October though the September gain was revised lower to 0.2% due to a lessened increase in residential building.
Residential building in October continued at about its earlier pace and rose 0.6%. New single family building rose 0.7% (11.6% y/y) following an upwardly revised 1.7% surge. The value of residential improvements fell 0.6% (-4.5% y/y) and a previously reported moderate September decline was revised to a 2.6% collapse.
Nonresidential building activity slipped moderately for the second consecutive month thanks to lower office construction (+5.9% y/y) which had been strong.
Public construction spending also fell moderately for the second month as construction activity on highways & streets, nearly one third of the value of public construction spending slipped 0.2% (14.0% y/y) after a 2.0% September surge.
These more detailed categories represent the Census Bureau’s reclassification of construction activity into end-use groups. Finer detail is available for many of the categories; for instance, commercial construction is shown for Automotive sales and parking facilities, drugstores, building supply stores, and both commercial warehouses and mini-storage facilities. Note that start dates vary for some seasonally adjusted line items in 2000 and 2002 and that constant-dollar data are no longer computed.
| Construction Put-in-place | Oct | Sept | Y/Y | 2004 | 2003 | 2002 |
|---|---|---|---|---|---|---|
| Total | 0.7% | 0.2% | 7.9% | 10.9% | 5.4% | 1.0% |
| Private | 0.3% | 0.4% | 6.9% | 13.6% | 6.3% | -0.4% |
| Residential | 0.6% | 0.7% | 8.3% | 18.2% | 12.9% | 8.5% |
| Nonresidential | -0.3% | -0.2% | 3.5% | 3.9% | -5.4% | -13.0% |
| Public | 1.9% | -0.5% | 11.7% | 2.5% | 2.7% | 5.7% |
by Carol Stone December 1, 2005
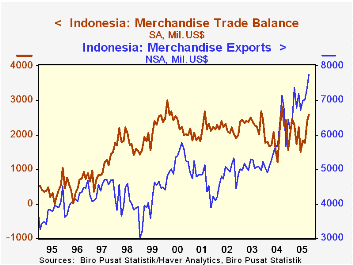
Indonesia's trade data for October, reported this morning, highlight two unexpected aspects of that oil-producing nation's economic development. In October, its monthly trade surplus was $2.6 billion, a large figure, but not the highest ever, and more importantly, only modestly above the $2.3 billion average for 2003, a time when oil and gas prices were considerably lower than they are now. Thus, even as oil and gas exports have risen, so have the country's imports, restraining the widening of the trade surplus. Further, in dollar terms, non-oil exports have risen more than oil-related exports. Total exports were $7.2 billion in October, up 41% from a monthly average of $5.1 billion in 2003. Such large growth in exports emphasizes how remarkable it is that the trade balance has changed so little.
When the first energy crisis hit in the mid-1970s, one concern was over how to "recycle petro-dollars". What would oil-exporting nations do with the large amounts of dollars they were newly receiving? Clearly, this is now a non-issue. The ability of businesses and consumers, at least in Indonesia, to seek out foreign merchandise to import recycles petro-dollars quite effectively. Imports in October were $4.6 billion, up 15% from the year-ago month and 70% from their 2003 average.
Further, oil and gas are hardly the only items Indonesia exports. Over time, Indonesian industry has diversified, so that non-energy products now constitute by far the bulk of its exports. Recently this share has been just above 75% and sometimes in recent years, it has reached 80%. By contrast in the mid-1980s when the data began to include some detail, non-energy exports were only about 25% of total exports. Lately, a look at industrial production data through 2004 suggests that chemicals and fabricated metals have been sources for this growth. Expansion of the chemical sector makes sense in light of the petroleum products already there. Interestingly, the wood and paper products that one might have traditionally thought of for Indonesia are no longer contributors to growth; their industrial production has been declining outright over the past several years.
| Indonesia: Foreign Trade Mil.$, Seas Adj* | Oct 2005 | Sept 2005 | Oct 2004 | Monthly Averages|||
|---|---|---|---|---|---|---|
| 2004 | 2003 | 2002 | ||||
| Trade Balance | 2579.6 | 2407.8 | 2254.1 | 1916.5 | 2375.6 | 2155.8 |
| Exports | 7191.4 | 7226.2 | 6259.1 | 5794.8 | 5088.1 | 4763.2 |
| Oil & Gas | 1820.9 | 1636.4 | 1401.6 | 1294.0 | 1136.9 | 1009.4 |
| Non-Oil & Gas | 5370.5 | 5589.8 | 4857.5 | 4500.8 | 3951.2 | 3753.8 |
| Imports | 4611.8 | 4818.4 | 4005.0 | 3878.3 | 2712.5 | 2607.4 |

Tom Moeller
AuthorMore in Author Profile »Prior to joining Haver Analytics in 2000, Mr. Moeller worked as the Economist at Chancellor Capital Management from 1985 to 1999. There, he developed comprehensive economic forecasts and interpreted economic data for equity and fixed income portfolio managers. Also at Chancellor, Mr. Moeller worked as an equity analyst and was responsible for researching and rating companies in the economically sensitive automobile and housing industries for investment in Chancellor’s equity portfolio. Prior to joining Chancellor, Mr. Moeller was an Economist at Citibank from 1979 to 1984. He also analyzed pricing behavior in the metals industry for the Council on Wage and Price Stability in Washington, D.C. In 1999, Mr. Moeller received the award for most accurate forecast from the Forecasters' Club of New York. From 1990 to 1992 he was President of the New York Association for Business Economists. Mr. Moeller earned an M.B.A. in Finance from Fordham University, where he graduated in 1987. He holds a Bachelor of Arts in Economics from George Washington University.
More Economy in Brief

 Global| Feb 05 2026
Charts of the Week: Balanced Policy, Resilient Data and AI Narratives
by:Andrew Cates

