 Global| Dec 01 2005
U.S. Personal Income Lifted By Strong Wage Gain
by:Tom Moeller
|in:Economy in Brief
Summary
A strong 0.6% gain in wage & salary disbursements raised U.S. personal income by 0.4% in October. The increase in wages offset declines in proprietors' and rental income while the latest rise in total income followed an unrevised 1.7% [...]
A strong 0.6% gain in wage & salary disbursements raised U.S. personal income by 0.4% in October. The increase in wages offset declines in proprietors' and rental income while the latest rise in total income followed an unrevised 1.7% surge in September, though income in August was revised down slightly. Consensus expectations had been for 0.5% income growth in October.
The effects of Hurricanes Katrina, Rita & Wilma are reflected in the last three months' income figures. A description of these effects can be found here.
Wages & salary income doubled the previous months' rise and increased 0.6% (5.0% y/y) on the strength of a 1.4% (3.2% y/y) surge in factory sector wages. Service sector wages rose 0.6% (5.5% y/y) after an upwardly revised 0.5% September increase and government wages rose 0.2% (3.4% y/y).
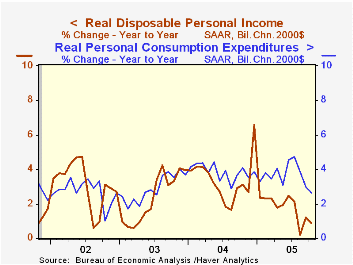
Disposable personal income rose 0.3% (4.2% y/y) following the unrevised 1.9% jump in September. Adjusted for the 0.1% rise in prices, take home pay rose 0.2% (0.9% y/y).
The PCE chain price index rose a modest 0.1% in October, held back by lower gasoline prices which caused nondurable prices to fall 0.4% (+5.1% y/y). Less food & energy the modest 0.1% increase additionally reflected lower light vehicle prices. Services price rose 0.4% (3.2% y/y) for the second month.
Personal consumption expenditures rose an expected, modest 0.2%. Light vehicle sales fell for the third consecutive month and lowered spending on durables by 2.5% (-2.0% y/y). Nondurables outlays rose 0.6% (9.1% y/y) but adjusted for the y/y gain in prices spending on nondurables rose a lesser 3.8% y/y. Services spending rose 0.5% (6.2% y/y).
| Disposition of Personal Income | Oct | Sept | Y/Y | 2004 | 2003 | 2002 |
|---|---|---|---|---|---|---|
| Personal Income | 0.4% | 1.7% | 5.3% | 5.9% | 3.2% | 1.8% |
| Personal Consumption | 0.2% | 0.5% | 6.1% | 6.5% | 4.9% | 4.2% |
| Savings Rate | -0.7% | -0.8% | 1.1% (Oct '04) | 1.7% | 2.1% | 2.4% |
| PCE Chain Price Index | 0.1% | 0.9% | 3.3% | 2.6% | 1.9% | 1.4% |
| Less food & energy | 0.1% | 0.2% | 1.8% | 2.0% | 1.3% | 1.8% |

Tom Moeller
AuthorMore in Author Profile »Prior to joining Haver Analytics in 2000, Mr. Moeller worked as the Economist at Chancellor Capital Management from 1985 to 1999. There, he developed comprehensive economic forecasts and interpreted economic data for equity and fixed income portfolio managers. Also at Chancellor, Mr. Moeller worked as an equity analyst and was responsible for researching and rating companies in the economically sensitive automobile and housing industries for investment in Chancellor’s equity portfolio. Prior to joining Chancellor, Mr. Moeller was an Economist at Citibank from 1979 to 1984. He also analyzed pricing behavior in the metals industry for the Council on Wage and Price Stability in Washington, D.C. In 1999, Mr. Moeller received the award for most accurate forecast from the Forecasters' Club of New York. From 1990 to 1992 he was President of the New York Association for Business Economists. Mr. Moeller earned an M.B.A. in Finance from Fordham University, where he graduated in 1987. He holds a Bachelor of Arts in Economics from George Washington University.
More Economy in Brief

 Global| Feb 05 2026
Charts of the Week: Balanced Policy, Resilient Data and AI Narratives
by:Andrew Cates

