 Global| Aug 28 2020
U.S. Personal Spending and Income Rise in July
by:Sandy Batten
|in:Economy in Brief
Summary
• Spending rose for third consecutive month, points to strong Q3. • Wages and salaries rose but government payments fell again. • Annual price inflation picks up but still well below Fed's target. Personal consumption expenditures [...]
• Spending rose for third consecutive month, points to strong Q3.
• Wages and salaries rose but government payments fell again.
• Annual price inflation picks up but still well below Fed's target.
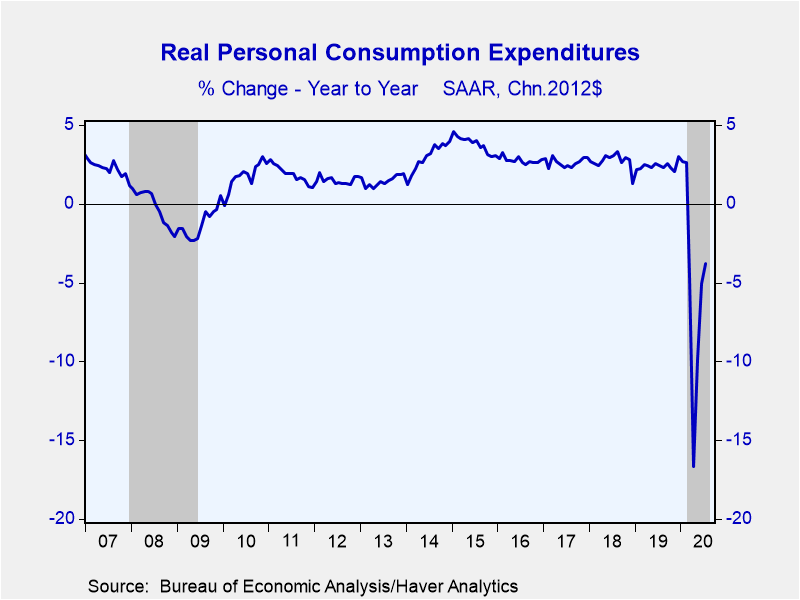
Personal consumption expenditures increased 1.9% m/m (-2.8% y/y) in July following an upwardly revised 6.2% m/m gain in June (initially 5.6%) and a slightly upwardly revised 8.6% increase in May (previously 8.5%). After having fallen in February, March and April, PCE has risen 17.5% over the past three months. However, it is still 4.6% below its recent peak in January. The Action Economics Forecast Survey had looked for a 1.5% m/m rise in spending in July. In constant dollars, real consumer spending rose 1.6% m/m (-3.8% y/y) in July on top of a 5.7% m/m increase in June and an 8.4% m/m gain in May.
The pandemic-generated weakness in PCE was concentrated in March and April with real spending rebounding in May, June and July. This pattern points to a sharp rebound in real PCE in Q3 vs. Q2. The July level of real PCE is 36.7% at an annual rate above the Q2 average, meaning that even if there is no change in real PCE in August and September, real PCE will be up 36.7% q/q saar in Q3 and thereby provide nearly 25%-points to overall real GDP growth.
In the detail of spending for July, real spending on durable goods increased 2.5% m/m (+13.4% y/y) vs. 7.9% m/m in June and a 28.5% m/m jump in May. The rebound in spending on motor vehicles continued with those sales up 3.7% m/m in July. Real spending on nondurable goods slowed to 1.2% m/m (+4.1% y/y) in July from 4.4% in June. Spending on services remains the drag on overall spending. It rose 1.6% m/m (-8.6% y/y) in July after a 5.7% m/m rise in June but is still 9.7% below its February peak. Spending at hotels and restaurants rose 5.2% m/m (-22.6% y/y) for its third consecutive monthly increase. However, it is still 23% below its January peak.
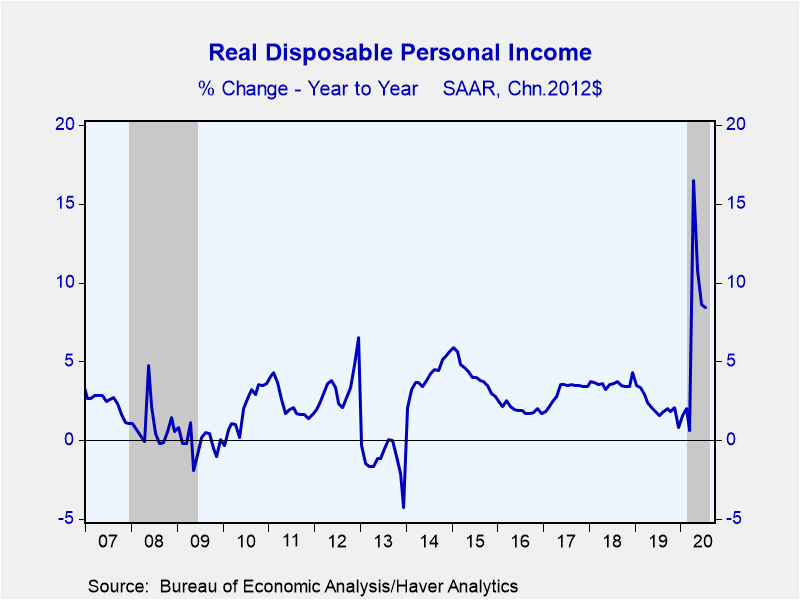
Personal income gained 0.4% m/m (+8.2% y/y) in July after declines in both June and May that were revised up slightly. The Action Economics Forecast Survey had looked for a 0.5% m/m decline in July. Wages and salaries rose for the third consecutive month (+1.4% m/m in July), indicating some healing taking place in labor markets. However, government transfer payments fell 1.4% m/m for their third consecutive monthly decline after having doubled in April. Disposable personal income edged up 0.2% m/m (+9.5% y/y) in July following declines in both June and May. Adjusted for price inflation, take-home pay decreased 0.1% m/m (+8.4% y/y) in July, its third consecutive monthly decline after a government transfer payment boosted 15.4% m/m jump in April.
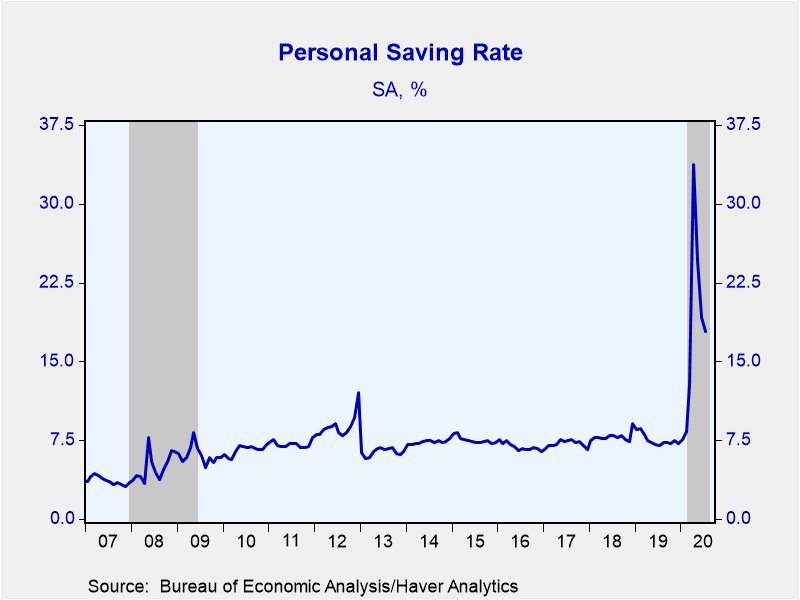
Last month's rise in spending relative to income lowered the personal saving rate again, to 17.8% from 19.2% in June. The rate reached a record high 33.7% in April. With households uncertain about how the ongoing pandemic will impact their economic wellbeing, the level of personal saving has risen markedly since February. In July, the level of personal saving was up 179% from a year earlier.
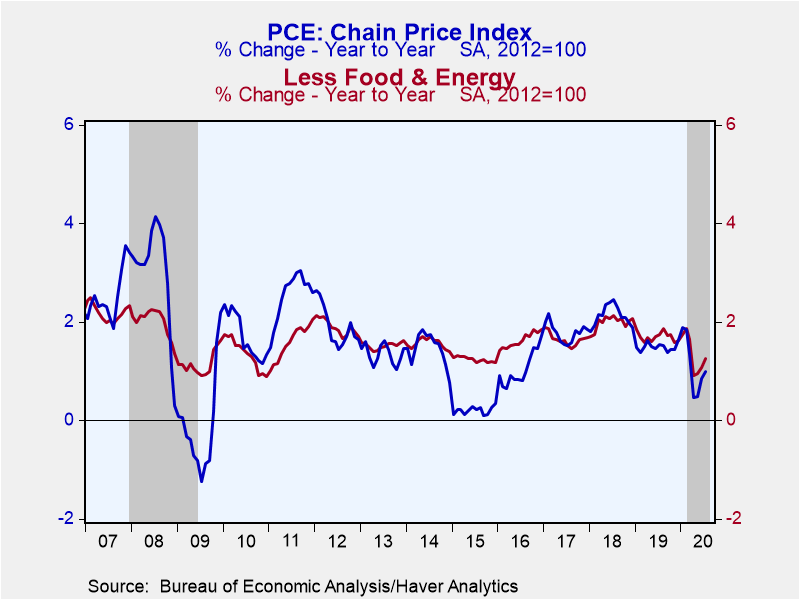
The PCE chain price index increased 0.3% m/m (+1.0% y/y) in July, down from a 0.5% m/m rise in June (revised up from a 0.4% m/m gain). The price index excluding food and energy prices also rose 0.3% (+1.3% y/y) in July. Both y/y rates are well below the Fed's 2% target. Energy prices increased 2.5% m/m in July, their second consecutive monthly increase after five months of decline. Food prices fell 0.9% m/m, their first monthly decline in seven months.
The personal income and consumption figures are available in Haver's USECON database with detail in the USNA database. The Action Economics figures are in the AS1REPNA database.
Sandy Batten
AuthorMore in Author Profile »Sandy Batten has more than 30 years of experience analyzing industrial economies and financial markets and a wide range of experience across the financial services sector, government, and academia. Before joining Haver Analytics, Sandy was a Vice President and Senior Economist at Citibank; Senior Credit Market Analyst at CDC Investment Management, Managing Director at Bear Stearns, and Executive Director at JPMorgan. In 2008, Sandy was named the most accurate US forecaster by the National Association for Business Economics. He is a member of the New York Forecasters Club, NABE, and the American Economic Association. Prior to his time in the financial services sector, Sandy was a Research Officer at the Federal Reserve Bank of St. Louis, Senior Staff Economist on the President’s Council of Economic Advisors, Deputy Assistant Secretary for Economic Policy at the US Treasury, and Economist at the International Monetary Fund. Sandy has taught economics at St. Louis University, Denison University, and Muskingun College. He has published numerous peer-reviewed articles in a wide range of academic publications. He has a B.A. in economics from the University of Richmond and a M.A. and Ph.D. in economics from The Ohio State University.
More Economy in Brief
 Global| Feb 05 2026
Charts of the Week: Balanced Policy, Resilient Data and AI Narratives
by:Andrew Cates


