 Global| Feb 17 2021
U.S. PPI Advances 1.3% in January
Summary
• Gasoline prices surged 13.6% m/m. • Core goods prices rose 0.8%, largest monthly increase. • Service prices driven upward as trade services rebounded. The Producer Price Index for final demand rose 1.3% (1.7% y/y) in January [...]
• Gasoline prices surged 13.6% m/m.
• Core goods prices rose 0.8%, largest monthly increase.
• Service prices driven upward as trade services rebounded.
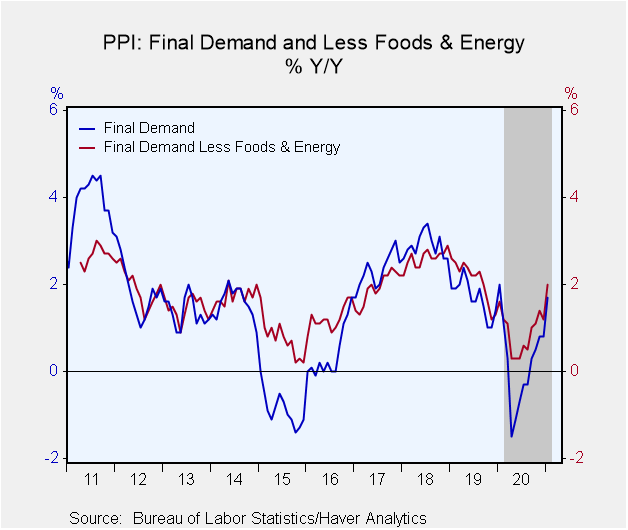
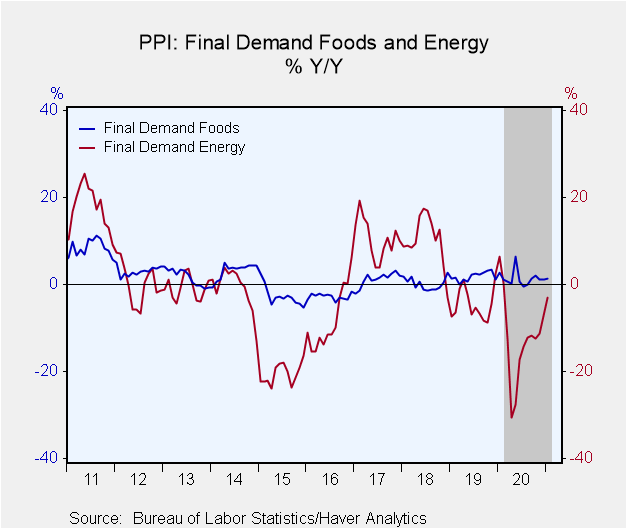
The Producer Price Index for final demand rose 1.3% (1.7% y/y) in January following 0.3% in December and 0.1% in November. Energy prices surged 5.1% m/m (-3.0% y/y) in January following a 4.9% advance in December. Food prices edged up 0.2% in January (1.4% y/y), reversing a 0.2% decrease in December. Prices of trade services turned higher by 1.0% (2.3% y/y) after December's 0.8% decline. Excluding foods, energy and trade service, the "core" advance was 1.2% in January, with 0.4% in December and 0.2% in November. The Action Economics Forecast Survey had looked for a 0.4% increase in the total index in January with the core rate forecast at 0.2%.
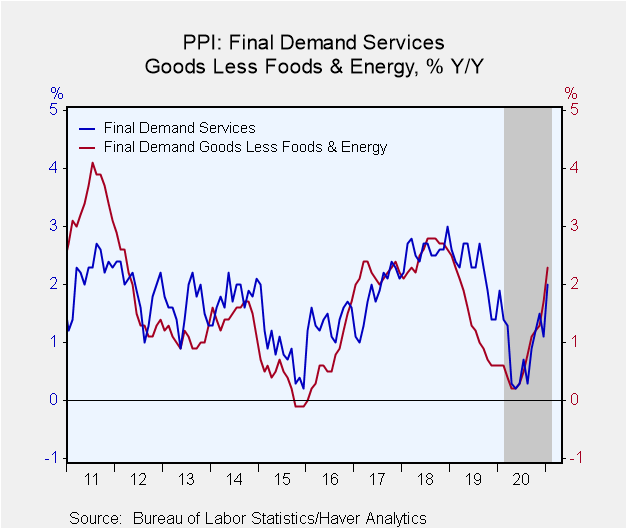
Final demand goods prices rose 1.4% m/m (1.3% y/y) in January, their largest monthly gain since the same amount in May. Yet again, a sizable share of the January increase – about 40%, according to the BLS – was due to gasoline, which rose 13.6%, following 13.5% in December. Do note that the year/year move in final demand gasoline prices was a decline of 11.4%. Home heating oil prices, which had jumped 48.4% in December, continued upward by 6.2% in January. No. 2 diesel fuel extended an uptrend into a fourth month, increasing 7.6% in January (9.2% y/y) after 11.1% in December. Final demand goods prices less food and energy rose 0.8% last month (2.3% y/y), after 0.5% in December; the January advance was the largest on record, which extends back to December 2009. Finished consumer goods prices less food and energy rose 0.4% m/m (1.7% y/y) in January, and private capital equipment prices rose 0.3% (1.5% y/y).
Prices for final demand services advanced 1.3% last month (2.0% y/y) after decreasing 0.1% in December. Trade services prices, which had slumped 0.8% m/m in December, rebounded by 1.0% in January (2.3% y/y). This category, which accounts for nearly 1/3 of final demand services prices, measures changes in margins received by wholesalers and retailers, not actual prices. Prices of transportation and warehouse services rose 1.3% (-3.7% y/y). Services prices excluding trade margins, transportation and warehousing rose 0.2% m/m (1.5% y/y) in December; the most prominent category was actually portfolio management fees, which rose 9.4% last month (15.9% y/y)
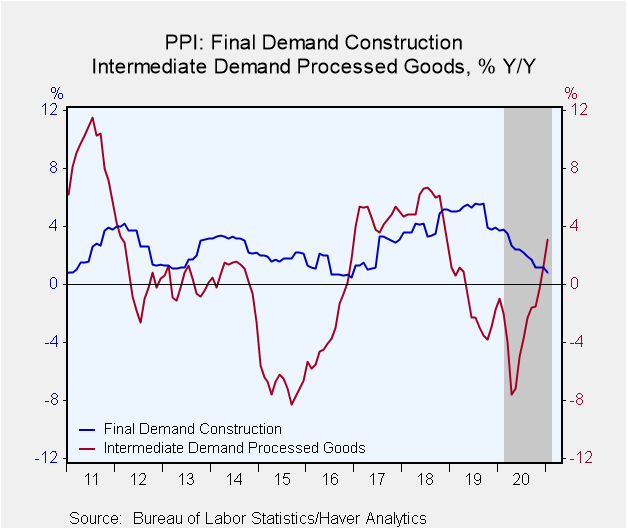
The cost of construction edged 0.2% higher (0.8% y/y) in January, following 0.1% in both November and December.
Intermediate product prices for processed goods rose 1.7% m/m (3.1% y/y) in January, the largest monthly increase since the same amount in January 2010; this followed increases of 1.4% in December and 1.3% in November.
The PPI data are published by the Bureau of Labor Statistics and can be found in Haver's USECON database. Further detail is contained in PPI and PPIR. The expectations figures are available in the AS1REPNA database.
| Producer Price Index (SA, %) | Jan | Dec | Nov | Jan Y/Y | 2020 | 2019 | 2018 |
|---|---|---|---|---|---|---|---|
| Final Demand | 1.3 | 0.3 | 0.1 | 1.7 | 0.2 | 1.7 | 2.9 |
| Excluding Food & Energy | 1.2 | 0.1 | -0.1 | 2.0 | 0.9 | 2.1 | 2.6 |
| Excluding Food, Energy & Trade Services | 1.2 | 0.4 | 0.2 | 2.0 | 0.7 | 2.0 | 2.8 |
| Goods | 1.4 | 1.0 | 0.3 | 1.3 | -1.4 | 0.4 | 3.4 |
| Foods | 0.2 | -0.2 | 0.6 | 1.4 | 1.4 | 1.9 | 0.2 |
| Energy | 5.1 | 4.9 | 1.3 | -3.0 | -12.9 | -4.6 | 10.2 |
| Goods Excluding Food & Energy | 0.8 | 0.5 | 0.2 | 2.3 | 0.7 | 1.4 | 2.5 |
| Services | 1.3 | -0.1 | -0.2 | 2.0 | 0.9 | 2.3 | 2.6 |
| Trade Services | 1.0 | -0.8 | -0.6 | 2.3 | 1.6 | 2.4 | 1.8 |
| Construction | 0.2 | 0.1 | 0.1 | 0.8 | 2.3 | 5.0 | 4.1 |
| Intermediate Demand - Processed Goods | 1.7 | 1.4 | 1.3 | 3.1 | -2.9 | -1.4 | 5.3 |
Carol Stone, CBE
AuthorMore in Author Profile »Carol Stone, CBE came to Haver Analytics in 2003 following more than 35 years as a financial market economist at major Wall Street financial institutions, most especially Merrill Lynch and Nomura Securities. She had broad experience in analysis and forecasting of flow-of-funds accounts, the federal budget and Federal Reserve operations. At Nomura Securities, among other duties, she developed various indicator forecasting tools and edited a daily global publication produced in London and New York for readers in Tokyo. At Haver Analytics, Carol was a member of the Research Department, aiding database managers with research and documentation efforts, as well as posting commentary on select economic reports. In addition, she conducted Ways-of-the-World, a blog on economic issues for an Episcopal-Church-affiliated website, The Geranium Farm. During her career, Carol served as an officer of the Money Marketeers and the Downtown Economists Club. She had a PhD from NYU's Stern School of Business. She lived in Brooklyn, New York, and had a weekend home on Long Island.
More Economy in Brief
 Global| Feb 05 2026
Charts of the Week: Balanced Policy, Resilient Data and AI Narratives
by:Andrew Cates


