 Global| Aug 19 2008
U.S. PPI Up 1.2%; Big Increases Widespread
Summary
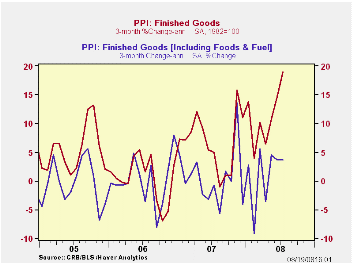
Producer prices continued strongly higher in July, with the total index up 1.2% after June’s outsized 1.8%, and the core up a substantial 0.7%, considerably more than June’s 0.2%. Forecasts for the total index centered around 0.6% and [...]

Producer prices continued strongly higher in July, with the
total index up 1.2% after June’s outsized 1.8%, and the core up a
substantial 0.7%, considerably more than June’s 0.2%. Forecasts for the
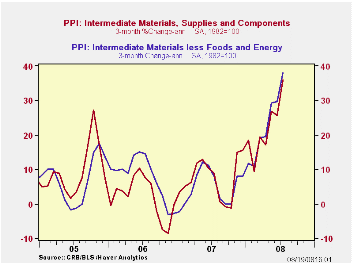
total index centered around 0.6% and for the core, 0.2%. Intermediate
goods rose 2.7%, with their core up 2.0% and crude goods were up 4.2%,
with the core up 3.4%. All of these are monthly changes; year-on-year,
finished goods prices are up 9.8% and crude goods a whopping 51.3%.
What we know, though, before we panic over these inflationary
figures, is that the PPI data are collected near mid-month,
specifically the Tuesday of the week containing the 13th of the month.
For July, that day would be Tuesday, July 15, now five weeks ago. That
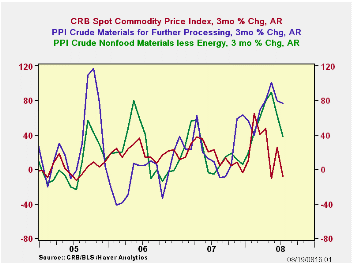
period was near the peak in commodity prices; by yesterday, futures
prices, measured by the Reuters/Jeffries CRB Futures Index had fallen
14.6% since that date, and the CRB Spot Index was down 5.5%. So while
the previous gains in commodity prices continue through the production
and distribution system, we do know that some relief might already be
in process.
Meantime, the bigger-than-expected gain in the July finished goods index did hit a wide variety of items. Food was a notable exception, inching up only 0.3% from June. But energy rose 3.1%, concentrated in residential gas (8.8%) and heating oil (3.7%); before seasonal adjustment, gasoline was up 2.8%, but that was all seasonal (believe it or not!), so that with adjustment, it was actually down 0.2% (sure.) Among consumer goods with better-than-1% monthly increases are soaps & detergents, tires & tubes, newspapers, floor coverings, sporting goods and fine jewelry. Capital equipment overall saw an 0.8% rise, seasonally adjusted. Among the larger advances there are machine tools, materials handling equipment, pumps, transformers, heavy trucks and ships. Passenger car wholesale prices rose 0.5% in July and light trucks 0.8%, both seasonally adjusted. Several of these show the effects of earlier increases in lumber, petroleum and metals and we can hope that renewed declines in those raw materials can help alleviate further price pain.


| Producer Price Index (%) | July | June | Yr/Yr | 2007 | 2006 | 2005 |
|---|---|---|---|---|---|---|
| Finished Goods | 1.2 | 1.8 | 9.8 | 3.9 | 3.0 | 4.9 |
| Core | 0.7 | 0.2 | 3.6 | 1.9 | 1.5 | 2.4 |
| Intermediate Goods | 2.7 | 2.1 | 16.8 | 4.1 | 6.4 | 8.0 |
| Core | 2.0 | 1.3 | 10.2 | 2.8 | 6.0 | 5.5 |
| Crude Goods | 4.2 | 3.7 | 51.3 | 12.1 | 1.4 | 14.6 |
| Core | 3.4 | -0.2 | 36.9 | 15.6 | 20.8 | 4.9 |
Carol Stone, CBE
AuthorMore in Author Profile »Carol Stone, CBE came to Haver Analytics in 2003 following more than 35 years as a financial market economist at major Wall Street financial institutions, most especially Merrill Lynch and Nomura Securities. She had broad experience in analysis and forecasting of flow-of-funds accounts, the federal budget and Federal Reserve operations. At Nomura Securities, among other duties, she developed various indicator forecasting tools and edited a daily global publication produced in London and New York for readers in Tokyo. At Haver Analytics, Carol was a member of the Research Department, aiding database managers with research and documentation efforts, as well as posting commentary on select economic reports. In addition, she conducted Ways-of-the-World, a blog on economic issues for an Episcopal-Church-affiliated website, The Geranium Farm. During her career, Carol served as an officer of the Money Marketeers and the Downtown Economists Club. She had a PhD from NYU's Stern School of Business. She lived in Brooklyn, New York, and had a weekend home on Long Island.
More Economy in Brief
 Global| Feb 05 2026
Charts of the Week: Balanced Policy, Resilient Data and AI Narratives
by:Andrew Cates


