 Global| Mar 05 2008
U.S. Productivity Growth Revised Little, Unit Labor Costs Revised Up
by:Tom Moeller
|in:Economy in Brief
Summary
Nonfarm labor productivity growth during 4Q07 was revised little, to 1.9% growth from 1.8% reported initially. The figure still is a marked slowdown from the 3Q figure of 6.3% during 3Q07 which was revised up slightly. Consensus [...]
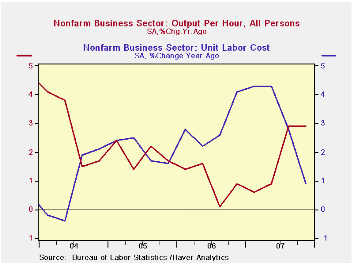
Nonfarm labor productivity growth during 4Q07 was revised little, to 1.9% growth from 1.8% reported initially. The figure still is a marked slowdown from the 3Q figure of 6.3% during 3Q07 which was revised up slightly. Consensus expectations had been for no revision to 4Q growth.
Growth in output last quarter was little changed at 0.3% and
still down sharply from 5.6% during 3Q. A 1.6% decline in hours worked
is what pulled productivity up and it was the sharpest q/q decline
since 2001.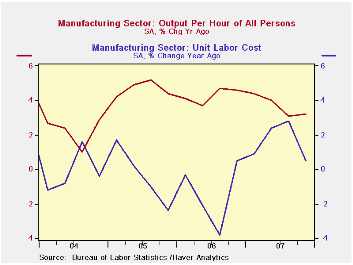
Compensation per hour last quarter was revised up to a 4.6% growth rate. Compensation growth for the year accelerated to a 4.9% rate of growth which was the quickest since 2000.
The upward revision to compensation raised the estimate of unit labor cost growth to 2.6% from 2.1%, and from the revised 3Q decline of 2.7%. The Consensus expectation had been for unit cost growth to be left unchanged at 2.1%. The 4Q rise was again enough to lift the gain in labor costs for the full year by 3.1%, the quickest since 2000.
Productivity in the factory sector eased to a little revised 2.3% rate of growth from 4.1% during 3Q. For all of 2007 factory sector productivity rose 3.7% versus 4.3% during 2006. Unit labor costs rose 2.1% after declines during the prior two quarters. For the full year unit labor costs in the factory sector rose 1.6% after two years of negative growth.
Condition of the U.S. Banking System is yesterday's Senate testimony by Fed Vice ChairmanDonald L. Kohn and it can be found here.
| Non-farm Business Sector (SAAR, %) | Q4 '07 (Revised) | Q4 '07 | Q3 '07 | Y/Y | 2007 | 2006 | 2005 |
|---|---|---|---|---|---|---|---|
| Output per Hour | 1.9 | 1.8 | 6.3 | 2.9 | 1.8 | 1.0 | 1.9 |
| Compensation per Hour | 4.6 | 3.9 | 3.4 | 3.9 | 4.9 | 3.9 | 4.0 |
| Unit Labor Costs | 2.6 | 2.1 | -2.7 | 0.9 | 3.1 | 2.9 | 2.0 |
by Tom Moeller March 5, 2008
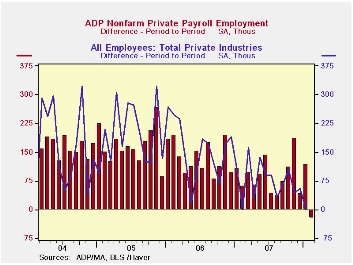
The ADP National Employment Report, from the payroll processor, indicated that private nonfarm payrolls fell 23,000 last month after a slightly revised increase of 119,000 during January.
The U.S. Bureau of Labor Statistics employment figure for February will be published Friday.Last month, the 119,000 rise in ADP's measure of private nonfarm payrolls subsequently was accompanied by a 1,000 worker increase in private sector payrolls.According to ADP and Macro Advisers, the correlation between the monthly percentage change in the ADP estimate and that in the BLS data is 0.90.
The ADP sub-index for large payrolls fell 34,000 (-0.6% y/y) after an 8,000 worker rise during January.
Medium sized payrolls fell 4,000 (+0.9% y/y) during February after a 47,000 increase the prior month.
Growth in small payrolls eased to 15,000 (1.4% y/y), the weakest monthly increase since 2002.
Employment in the goods producing industries fell 70,000 (-1.8% y/y) while services rose 47,000 (1.5% y/y).
ADP compiled the estimate from its database of individual companies' payroll information. Macroeconomic Advisers, LLC, the St. Louis economic consulting firm, developed the methodology for transforming the raw data into an economic indicator.
The ADP National Employment Report data is maintained in
Haver's USECON database; historical data
go back to December 2000. The figures in this report cover only private
sector jobs and exclude employment in the public sector, which rose an
average 11,083 during the last twelve months.
The full ADP National Employment Report can be found here, and the ADP methodology is explained here.
| LAXEPA@USECON | February | January | Y/Y | 2007 | 2006 | 2005 |
|---|---|---|---|---|---|---|
| Nonfarm Private Payroll Employment (m/m Chg.) | -23,000 | 119,000 | 0.9% | 1.1% | 1.7% | 1.8% |
by Tom Moeller March 5, 2008
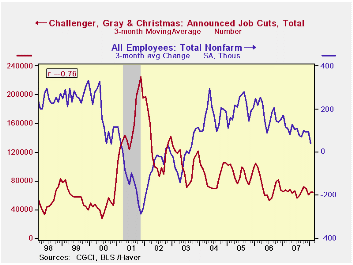
Challenger, Grey & Christmas reported that job cut announcements in February fell to 72,091 after 74,986 cuts during January. The average of announcements so far in 2008 is slightly below the 2007 average.
Job cut announcements rose m/m in the aerospace industry but fell in the auto industry. Layoffs in construction and computers also rose but they fell in electronics, financial and in the retail industry.
During the last ten years there has been a 76% (inverse) correlation between the three month moving average of announced job cuts and the three month change payroll employment.
Job cut announcements differ from layoffs. Many are achieved through attrition, early retirement or just never occur.
Challenger also reported that announced hiring plans were up slightly m/m but they were down sharply y/y.
| Challenger, Gray & Christmas | February | January | Y/Y | 2007 | 2006 | 2005 |
|---|---|---|---|---|---|---|
| Announced Job Cuts | 72,091 | 74,986 | -14.2% | 768,264 | 839,822 | 1,072,054 |
by Tom Moeller March 5, 2008
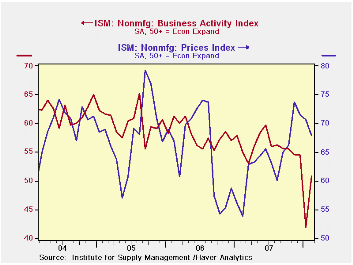
The Business Activity Index for the non-manufacturing sector, from the Institute for Supply Management, last month improved somewhat to a reading of 50.8 from 41.9 in January. Consensus expectations had been for less of an improvement to 47.7.
Despite the rise in February, the index remained near its lowest since 2003. A level of 50 is the break even point between rising and falling activity in the service sector.
Since the series' inception in 1997 there has been a 44%
correlation between the level of the Business Activity Index in the
non-manufacturing sector and the Q/Q change in real GDP for the
services and the construction sectors. The correlation of the factory
sector ISM index with the change in real GDP less just services is a
higher 57%, though over the last ten years it only has been 34%.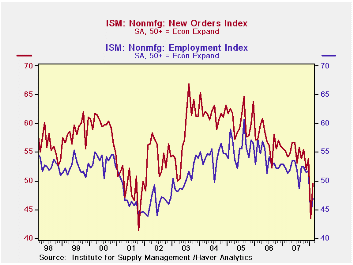
The new orders sub index rose m/m to a reading of 49.6 and made up a little more than half of its ten point decline during January.
Conversely, the employment sub index also rose but its 3.0 point rise to 46.9 made up less than half the January decline. That was to its lowest level since 2002. Since the series' inception in 1997 there has been a 56% correlation between the level of the ISM non-manufacturing employment index and the m/m change in payroll employment in the service producing plus the construction industries.
Pricing power again eased slightly m/m for the third month, however, the level of 67.9 remained well above that of the last two years. Since inception ten years ago, there has been a 60% correlation between the price index and the q/q change in the GDP services chain price index.
ISM surveys more than 370 purchasing managers in more than 62 industries including construction, law firms, hospitals, government and retailers. The non-manufacturing survey dates back to July 1997.
The Business Activity Index for the non-manufacturing sector reflects a question separate from the subgroups mentioned above. In contrast, the ISM manufacturing sector composite index is a weighted average of five components.
| ISM Nonmanufacturing Survey | February | January | February '07 | 2007 | 2006 | 2005 |
|---|---|---|---|---|---|---|
| Business Activity Index | 50.8 | 41.9 | 54.9 | 56.0 | 58.0 | 60.2 |
| Prices Index | 67.9 | 70.7 | 53.9 | 63.8 | 65.3 | 68.0 |
by Robert Brusca March 5, 2008
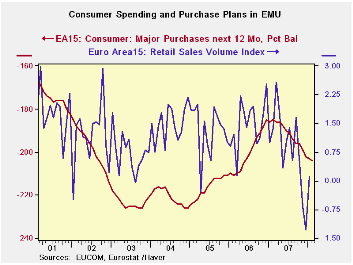
January Euro Area retail sales fell 1% in volume terms. Over three months growth has slowed marginally and is clinging in real terms to a 1% rate of growth. The volume of spending on food has picked up in the recent three months after negative growth rates of six and 12 months despite climbing prices. The volume of spending on nonfood items has steadily deteriorated: 12-month to 6-month to 3-month. This is matter of concern. Three of four EU countries depicted in the table details show sales decelerating in the recent three-month period. I say three since I include Italy that only offers nominal figures. Once inflation is subtracted surely Italy with nominal sales already so weak will add to the story of retail weakness in EMU. France shows some resilience. The UK, while showing some slowing, also shows some growth consumer is not about to hold growth aloft in the Euro Area. The purchase plans plotted in the chart underscore that fact of life.
| Euro Area 15 Retail Sales Volume | ||||||
|---|---|---|---|---|---|---|
| Jan-08 | Dec-07 | Nov-07 | 3-Mo | 6-MO | 12-Mo | |
| Total | 0.4% | -0.1% | -0.5% | -1.1% | -1.4% | 0.1% |
| Food | 0.6% | -0.5% | -0.7% | -2.8% | -1.4% | -0.9% |
| Nonfood | 0.4% | 0.0% | -0.4% | 0.0% | -1.6% | 0.7% |
| Textiles | #N/A | 0.3% | -0.6% | -13.0% | -2.0% | -0.6% |
| HH Goods | #N/A | 0.6% | -0.8% | -2.7% | -2.6% | -2.3% |
| Books news, etc | #N/A | -0.6% | 0.1% | -1.2% | -1.7% | 0.4% |
| Pharma | #N/A | 0.1% | 0.0% | 2.2% | 3.4% | 2.9% |
| Other Nonspecialized stores | #N/A | -0.2% | -0.6% | -3.0% | -2.1% | -2.1% |
| Mail Order | #N/A | 2.8% | -1.3% | 4.1% | 1.0% | -1.2% |
| Nonfood Country detail (volume) | ||||||
| Germany | 0.9% | -0.2% | -0.4% | 1.3% | -4.0% | 2.2% |
| France | -0.4% | 1.1% | -0.3% | 1.7% | 2.0% | 4.2% |
| Italy (Total; Value) | #N/A | 0.1% | -0.3% | 0.4% | 0.6% | 0.3% |
| UK (EU) | 1.2% | 0.0% | 0.5% | 6.8% | 5.6% | 7.6% |
| Shaded areas calculated on a one-month lag due to lagging data. | ||||||
| The EA 15 countries are Austria, Belgium, Cyprus, Finland, France, Germany, Greece, Ireland, Italy, Luxembourg, Malta, the Netherlands, Portugal, Slovenia and Spain. | ||||||
by Robert Brusca March 5, 2008
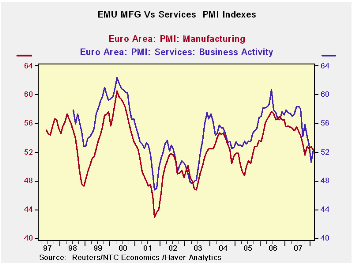
Services in the Euro Area bounced back in February but the index still resides in the lower portion of the range it has occupied since May of 2000. The overall index stands in its 39th percentile, about 10 percentage points below range mid-point. Germany and France have two of the ‘stronger’ service sector readings with indexes that are near or above their range midpoints at 50% and 56% respectively. Italy finds its service sector with the worst reading since this survey was taken. Similarly Spain and Ireland are weak in their range in the bottom 15 percentile or worse. The UK, an EU member country, finds its service sector in the 54th percentile. Its reading rose in February as well.
| NTC Services Indexes for EU/EMU | ||||||
|---|---|---|---|---|---|---|
| Feb-08 | Jan-08 | 3Mo | 6Mo | 12Mo | Percentile | |
| Euro-13 | 52.25 | 50.56 | 51.98 | 53.35 | 55.54 | 39.9% |
| Germany | 52.17 | 49.17 | 50.86 | 52.31 | 55.32 | 50.2% |
| France | 58.15 | 56.60 | 57.88 | 58.01 | 58.35 | 56.0% |
| Italy | 47.15 | 47.86 | 48.24 | 50.77 | 53.47 | 0.0% |
| Spain | 46.13 | 44.24 | 47.12 | 49.48 | 52.42 | 11.7% |
| Ireland | 48.27 | 51.90 | 51.23 | 52.96 | 55.19 | 14.6% |
| EU only | ||||||
| UK | 54.05 | 52.46 | 52.96 | 53.43 | 55.41 | 54.4% |
| percentile is over range since May 2000 | ||||||

Tom Moeller
AuthorMore in Author Profile »Prior to joining Haver Analytics in 2000, Mr. Moeller worked as the Economist at Chancellor Capital Management from 1985 to 1999. There, he developed comprehensive economic forecasts and interpreted economic data for equity and fixed income portfolio managers. Also at Chancellor, Mr. Moeller worked as an equity analyst and was responsible for researching and rating companies in the economically sensitive automobile and housing industries for investment in Chancellor’s equity portfolio. Prior to joining Chancellor, Mr. Moeller was an Economist at Citibank from 1979 to 1984. He also analyzed pricing behavior in the metals industry for the Council on Wage and Price Stability in Washington, D.C. In 1999, Mr. Moeller received the award for most accurate forecast from the Forecasters' Club of New York. From 1990 to 1992 he was President of the New York Association for Business Economists. Mr. Moeller earned an M.B.A. in Finance from Fordham University, where he graduated in 1987. He holds a Bachelor of Arts in Economics from George Washington University.
More Economy in Brief

 Global| Feb 05 2026
Charts of the Week: Balanced Policy, Resilient Data and AI Narratives
by:Andrew Cates

