 Global| May 06 2021
U.S. Productivity's Rise in Q1 Reverses the Decline in Q4
Summary
• Nonfarm worker productivity surges. • Compensation per hour rises in Q1'21. • Unit labor costs decline. Nonfarm business sector productivity rose 5.4% (SAAR, 4.1% y/y) during Q1'21, following a decline of 3.8% (SAAR, +2.6% y/y) in [...]
• Nonfarm worker productivity surges.
• Compensation per hour rises in Q1'21.
• Unit labor costs decline.
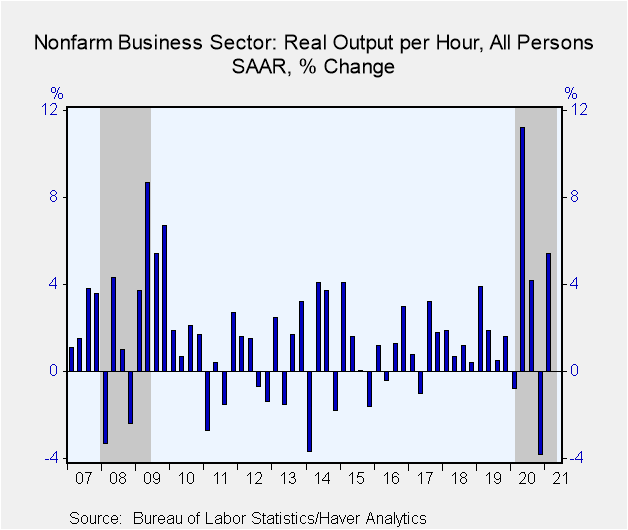
Nonfarm business sector productivity rose 5.4% (SAAR, 4.1% y/y) during Q1'21, following a decline of 3.8% (SAAR, +2.6% y/y) in Q4'20, revised from -4.2%. Productivity growth had reached 11.2% in Q2 last year, leaving the increase in productivity for the full year at 2.5%, the largest annual increase since 2010. A 4.1% rise had been expected in the Action Economics Forecast Survey.
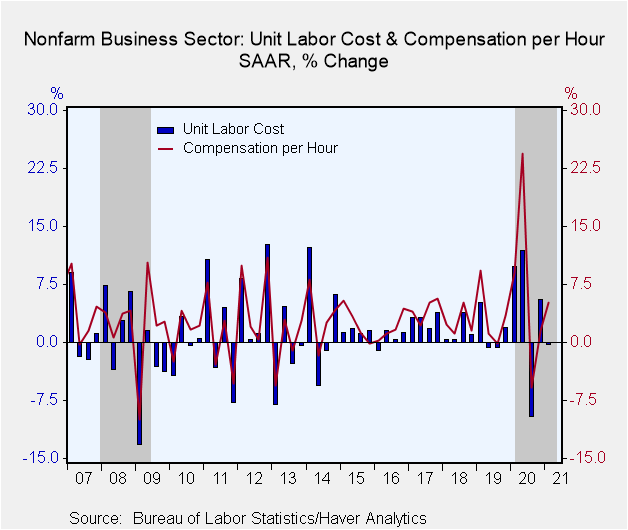
Q1'21 real output surged 8.4% (1.1% y/y) following a 5.8% (-2.6% y/y) rise in Q4, revised from 5.3%. Hours worked rose 2.9% (-2.9% y/y) after rising 10% in Q4, revised from a 10.7% rise. Not surprisingly, as output per persons rose sharply, unit labor costs declined in Q1 by -0.3% (1.6% y/y) versus the 5.6% (4.1%) rise in Q4. The Action Economics Survey showed an expected decline of 1.1%. Hourly compensation rose 5.1% (5.8% y/y), following a 1.6% rise in Q4 (6.7% y/y).
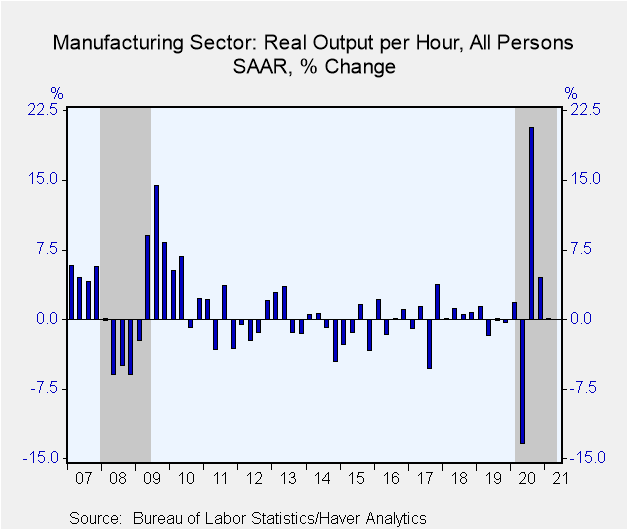
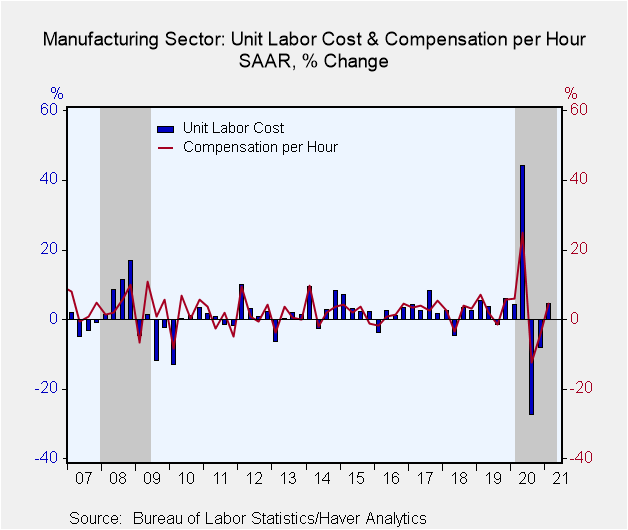
Productivity in the manufacturing sector increased 0.1% (2.2% y/y) following a 4.5% (2.7% y/y) advance in Q4, revised from a 3% rise. Durable goods manufacturing productivity rose 0.7% (3.9% y/y), following a 5.5% rise in Q4, while non-durable manufacturing productivity advanced 0.3% (0.1% y/y) following a 2.4% rise in Q4. Total manufacturing unit labor costs rose 4.6% (0.1% y/y), a reversal from the 8.2% (0.1% y/y) decline in Q4. Compensation per hour in the manufacturing sector rose 4.6% (2.4% Y/Y), following a 4.1% decline (2.7% y/y) in Q4.
Compensation and labor costs figures are available in Haver's USECON database.
| Productivity & Costs (SAAR, %) | Q1'21 | Q4'20 | Q3'20 | Q1'21 Y/Y | 2020 | 2019 | 2018 |
|---|---|---|---|---|---|---|---|
| Nonfarm Business Sector | |||||||
| Output per Hour (Productivity) | 5.4 | -3.8 | 4.2 | 4.1 | 2.5 | 1.8 | 1.4 |
| Compensation per Hour | 5.1 | 1.6 | -5.8 | 5.8 | 6.4 | 3.7 | 3.3 |
| Unit Labor Costs | -0.3 | 5.6 | -9.6 | 1.6 | 3.8 | 1.9 | 1.9 |
| Manufacturing Sector | |||||||
| Output per Hour (Productivity) | 0.1 | 4.5 | 20.7 | 2.2 | 0.3 | 0.2 | 0.4 |
| Compensation per Hour | 4.6 | -4.1 | -12.4 | 2.4 | 4.7 | 3.1 | 2.1 |
| Unit Labor Costs | 4.6 | -8.2 | -27.4 | 0.1 | 4.5 | 2.8 | 1.7 |
Kathleen Stephansen, CBE
AuthorMore in Author Profile »Kathleen Stephansen is a Senior Economist for Haver Analytics and an Independent Trustee for the EQAT/VIP/1290 Trust Funds, encompassing the US mutual funds sponsored by the Equitable Life Insurance Company. She is a former Chief Economist of Huawei Technologies USA, Senior Economic Advisor to the Boston Consulting Group, Chief Economist of the American International Group (AIG) and AIG Asset Management’s Senior Strategist and Global Head of Sovereign Research. Prior to joining AIG in 2010, Kathleen held various positions as Chief Economist or Head of Global Research at Aladdin Capital Holdings, Credit Suisse and Donaldson, Lufkin and Jenrette Securities Corporation.
Kathleen serves on the boards of the Global Interdependence Center (GIC), as Vice-Chair of the GIC College of Central Bankers, is the Treasurer for Economists for Peace and Security (EPS) and is a former board member of the National Association of Business Economics (NABE). She is a member of Chatham House and the Economic Club of New York. She holds an undergraduate degree in economics from the Universite Catholique de Louvain and graduate degrees in economics from the University of New Hampshire (MA) and the London School of Economics (PhD abd).
More Economy in Brief
 Global| Feb 05 2026
Charts of the Week: Balanced Policy, Resilient Data and AI Narratives
by:Andrew Cates


