 Global| Oct 15 2008
U.S. Retail Sales Drop 1.2% in September
Summary
Retail sales fell 1.2% last month, the Commerce Department reported this morning. Both August and July sales were revised lower, August to a 0.9% decrease from 0.7% reported last month, and July to a 0.1% increase from 0.3% in last [...]
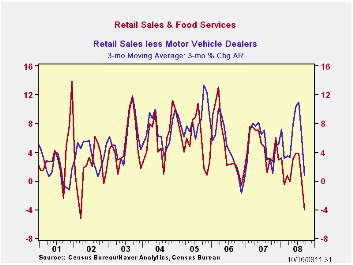
Retail sales fell 1.2% last month, the Commerce Department reported this morning. Both August and July sales were revised lower, August to a 0.9% decrease from 0.7% reported last month, and July to a 0.1% increase from 0.3% in last month's data. This puts the entire Q3 down at a 4% annual rate from Q2. The Action Economics survey shown in Haver's AS1REPNA database looked for a 1.0% decline in September. All the retail sales data are contained in Haver's USECON database.
Not only were total sales down in September, but every major
store group saw lower sales, except for stores and gas stations. Drug
stores, more formally known as "health & personal care stores",
were up 0.4%, and gas stations, 0.1%. [This latter seems odd, in view
of falling gasoline prices, but it seems to be a seasonal phenomenon;
sales not seasonally adjusted were down 7.8%, while September's
seasonal factor falls 8.1%.]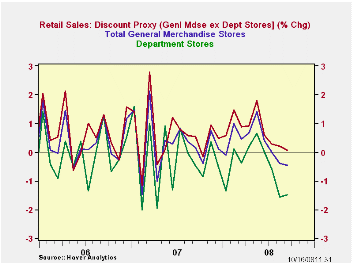
Among other major store groups, the biggest decline was at auto dealers, which saw a 3.8% plunge after their brief recovery in August, which itself was revised a bit lower. Furniture stores and electronics & appliance stores continued their steep downtrends, losing 2.3% and 1.5%, respectively. Furniture sales were off 10.7% from a year ago, their 13th consecutive year-on-year decline.
Individual store reports made a week ago indicated that discounters had done better than full-price retailers. This was evident in today's data in the comparative performance of general merchandise stores as a whole, which were off 0.4%, and mainline department stores down 1.5%. The subcategory we might call "discounters", that is, the whole general merchandise group less the department stores, rose 0.1% (see second graph). This isn't great, but it is in fact better than other segments.
Other noteworthy sectors include restaurants, down 0.5% in September, and nonstore retailers (mostly electronic shopping), down 0.8%. This latter group, as Tom Moeller has highlighted here before, has been weakening. A month ago, he reported it down 3.9% annualized from three months before; the comparable number this month is 10.7%! This category also includes fuel oil dealers, so falling oil prices could be pulling it down. This level of detail won't be published until next month's release.
| September | August | July | Y/Y | 2007 | 2006 | 2005 | |
|---|---|---|---|---|---|---|---|
| Retail Sales & Food Services (%) | -1.2 | -0.5 | -0.6 | -1.0 | 4.0 | 5.8 | 6.4 |
| Excluding Autos | -0.6 | -0.9 | 0.1 | 3.6 | 4.4 | 6.8 | 7.5 |
| Less Gasoline | -0.7 | -0.6 | 0.1 | 1.6 | 4.1 | 6.2 | 6.4 |
by Carol Stone October 15, 2008
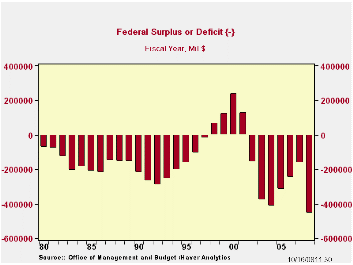
The U.S. government's budget deficit for fiscal year 2008 widened sharply to $454.8B versus a deficit during FY 2007 of $161.5B. Reversing recent trends of strengthening revenues, the deficit spread resulted from an outright decline in revenues, while outlays picked up smartly.
As a percentage of GDP the budget deficit last year totaled roughly 3.2%, a contrast to FY07's marginal 1.2%. Receipts were 17.8% of GDP, down from 18.8% and outlays rose to 21.0%.
The Government's financial data are available in Haver's USECON
database, with extensive detail available in the specialized GOVFIN.
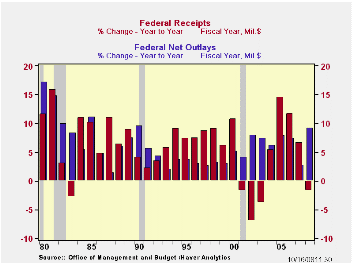
Net revenues last fiscal year fell 1.7%, reversing FY07's 6.7% increase. Both individual income taxes and corporate taxes fell, the former by 1.5% and the latter, 17.8%. The "stimulus" rebates were the main factor in the lower individual taxes, as well as weaker capital gains and less growth in wages and salaries. Corporate taxes were lowered by weakening profits. Also, during the September hurricanes, impacted companies were able to postpone their September tax installments. In contrast, various unemployment and social insurance grew 3.6%, somewhat soft, but well within recent growth ranges.
U.S. government outlays grew just 9.1% during last fiscal year, a significant pickup from 2007's 2.8% rise. Defense spending (19% of total outlays) surged by 13.2%, with both war-related and standard uses contributing. Medicare expenditures (12% of outlays) slowed to "just" a 4.1% increase after the prior 13.8% increase. Social security spending (21% of outlays) also slowed, rising 5.3% from 6.9% in FY07. Net interest payments increased 4.6% in FY08, similar to the previous 5.0%.
| US Government Finance | September | August | Y/Y | FY 2008 | FY 2007 | FY 2006 |
|---|---|---|---|---|---|---|
| Budget Balance | +$45.7B | $-111.9B | +$112.9B (9/07) |
-$454.8B | -$162.8B | -$248.2B |
| Net Revenues | $272.4B | $157.0B | -4.5% | -1.7% | 6.7% | 11.8% |
| Net Outlays | $226.7B | $268.9B | 31.4% | 9.1% | 2.8% | 7.4% |
by Robert Brusca October 15, 2008
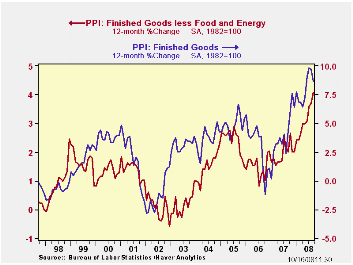
The PPI emitted mixed signals in September. The headline
finished goods PPI dropped a sharp 0.4% as energy prices fell. But the
core PPI for consumer goods rose by a sharp 0.5% an uncomfortable
harbinger for the CPI core that is due for release tomorrow.
Wholesale food prices were tempered in September rising by
just 0.2%. Food in general has seen its inflation profile lowered as
its Yr/yr pace of 8.1% far exceed its three-month pace of 3.1%.
Finished energy prices are off sharply, dropping by 2.9% in
the month. They are also off at a 16.7% annual rate in the quarter.
That is the constructive side of the inflation trend. But the Fed looks
harder at core inflation and there trends are still worsening.
But for core consumer goods Yr/Yr inflation has gone from 4.4%
over 12 months to 5.1% over six months to 5.3% over three months. That
is an uncomfortable trend.
However, the weakness in the economy and the ongoing financial
crisis will put this PPI on the back burner. The Fed is not giving up
on fighting inflation instead it knows that economic conditions such as
these will snuff out inflation without special action by the central
bank. Extreme economic weakness does that.
For now the economy picture is mess. The economy is weakening
fast. The financial sector is in shambles and inflation is still
accelerating and moving out over the Fed's comfort zone. But we know
that is just a snap shot of an ever changing environment. In fact
inflation is about to be extinguished by the economic weakness that
appears to be getting worse. Meanwhile, the Fed and the Treasury have
made great strides in trying to contain the financial unraveling. Their
attempt at containment appears to be a success – so far. Aid for the
ailing economy has not yet moved up to the actionable stage but
Congress is making plans for a stimulus plan. This is one of those
times that you must look at the indicators with a broader perspective.
At another time this PPI report would be viewed as a bad PPI and as
trouble for the Fed. But in this environment the report will not gather
headlines – hardly even footnotes.
| Key Trends In Producer Prices | ||||||
|---|---|---|---|---|---|---|
| Sep-08 | PPI Trends By Type Of Good | CHANGE | ||||
| PPI | 1Mo:M/M | 3-Mo:ar | 6-Mo:ar | 1-Yr | Yr-Ago | Y/Y |
| Total PPI | -0.4% | -0.4% | 6.8% | 8.7% | 4.4% | 4.3% |
| Finished Consumer Goods | -0.6% | -2.3% | 7.5% | 10.2% | 5.2% | 5.0% |
| Consumer Foods | 0.2% | 3.1% | 6.1% | 8.1% | 5.8% | 2.3% |
| Finished Consumer Goods Excl Foods | -0.9% | -4.2% | 8.0% | 11.1% | 5.0% | 6.1% |
| Nondurables less Food | -1.3% | -6.8% | 9.7% | 14.1% | 7.0% | 7.1% |
| Consumer Nondurable Goods excl Food & Energy | 0.5% | 6.8% | 6.4% | 5.8% | 3.4% | 2.4% |
| Durable Goods | 0.4% | 3.5% | 3.5% | 2.5% | 0.8% | 1.7% |
| Finished Core Consumer Goods | 0.5% | 5.3% | 5.1% | 4.4% | 2.2% | 2.2% |
| Capital Goods | 0.5% | 5.6% | 4.8% | 3.7% | 1.6% | 2.1% |
| MFG Industries | 0.5% | 6.3% | 5.8% | 4.3% | 1.8% | 2.5% |
| Non-MFG Industries | 0.5% | 5.4% | 4.4% | 3.5% | 1.5% | 2.0% |
| Core PPI | 0.4% | 5.4% | 4.9% | 4.1% | 2.0% | 2.1% |
| Memo: Finished Energy | -2.9% | -16.7% | 12.4% | 22.3% | 10.3% | 11.9% |
by Robert Brusca October 15, 2008
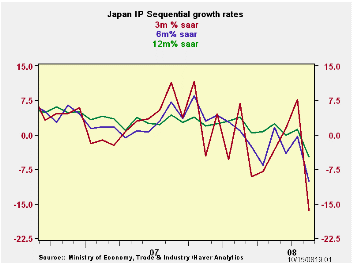
What a shock to those that thought that decoupling was a
reality. The US slowdown clearly has spread to Japan and to Europe. The
August drop in output is just one of the visible signs. July’s 1.3%
rise in IP is sandwiched between drops of 3.5% in August and 2.2% in
June. The global slowdown is everywhere. The financial crisis, of
course, is going to deepen it. The developing world ‘demand
juggernauts’ India and China will not escape the slowing either.
The decline is hitting Japan especially hard in transportation
as high gas prices have adversely impacted consumer budgets in the US.
A key issue for Japan is that car sales have plummeted. Even makers of
fuel efficient cars have seen demand fall off. The most highly sought
after models have been in short supply. Thus, even fuel efficient auto
makers are having trouble – no one escapes the downturn.
The outlook is for weakness to continue and probably to deepen. The hit to industrial output in Japan, while relatively severe, is not over.
| Japan Industrial Production Trends | ||||||||
|---|---|---|---|---|---|---|---|---|
| m/m % | Saar % | Yr/Yr | Qtr-2-Date | |||||
| seas adjusted | Aug-08 | Jul-08 | Jun-08 | 3-mo | 6-mo | 12-mo | Yr-Ago | % AR |
| Mining & mfg | -3.5% | 1.3% | -2.2% | -16.4% | -10.1% | -4.7% | 4.4% | -6.0% |
| Total Industry | -3.6% | 1.5% | -2.2% | -16.1% | -10.2% | -4.7% | 4.4% | -5.4% |
| MFG | -3.5% | 1.2% | -2.1% | -16.4% | -10.1% | -4.7% | 4.4% | -6.2% |
| Textiles | -0.2% | -2.9% | -1.6% | -17.5% | -13.5% | -10.0% | -6.2% | -20.9% |
| T-port | -9.8% | 4.0% | -5.0% | -36.9% | -19.3% | -7.8% | 9.7% | -9.3% |
| Product Group | ||||||||
| Consumer Goods | -3.3% | 3.6% | -3.1% | -11.3% | -8.0% | -3.2% | 6.3% | 7.9% |
| Intermediate Goods | -2.3% | -0.2% | -0.6% | -11.7% | -7.1% | -2.6% | 4.0% | -7.0% |
| Investment Goods | -5.2% | -0.5% | -2.9% | -29.8% | -18.5% | -10.9% | 2.8% | -22.1% |
| Mining | 1.6% | 4.2% | 1.9% | 35.1% | 15.3% | 4.3% | -1.1% | 28.2% |
| Electricity & Gas | -7.6% | 6.3% | -3.4% | -19.2% | -21.9% | -5.1% | 2.9% | 1.4% |
Carol Stone, CBE
AuthorMore in Author Profile »Carol Stone, CBE came to Haver Analytics in 2003 following more than 35 years as a financial market economist at major Wall Street financial institutions, most especially Merrill Lynch and Nomura Securities. She had broad experience in analysis and forecasting of flow-of-funds accounts, the federal budget and Federal Reserve operations. At Nomura Securities, among other duties, she developed various indicator forecasting tools and edited a daily global publication produced in London and New York for readers in Tokyo. At Haver Analytics, Carol was a member of the Research Department, aiding database managers with research and documentation efforts, as well as posting commentary on select economic reports. In addition, she conducted Ways-of-the-World, a blog on economic issues for an Episcopal-Church-affiliated website, The Geranium Farm. During her career, Carol served as an officer of the Money Marketeers and the Downtown Economists Club. She had a PhD from NYU's Stern School of Business. She lived in Brooklyn, New York, and had a weekend home on Long Island.


