 Global| Sep 13 2013
U.S. Retail Sales Have Small August Rise, but Durable-Good- Type Stores Generally Firmer
Summary
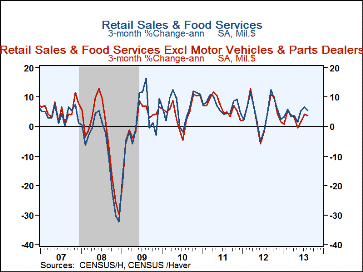
Retail sales rose 0.2% in August (+4.7% y/y), less than in July, but that month and June were both revised modestly higher, July to 0.4% from 0.2% and June to 0.7% from 0.6%. A 0.4% rise had been expected according to Action Economics [...]
 Retail sales rose 0.2% in August (+4.7% y/y), less than in July, but that month and June were both revised modestly higher, July to 0.4% from 0.2% and June to 0.7% from 0.6%. A 0.4% rise had been expected according to Action Economics survey. Total sales excluding motor vehicles eased to a 0.1% increase in August (+3.3% y/y) from 0.6% in July, which was revised from 0.5%. The latest increase also came below expectations, which looked for a 0.3% advance.
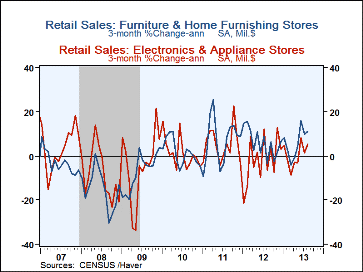
Sales at motor vehicles & parts dealers rebounded by 0.9% (+10.9% y/y) last month, and July was revised to a 0.5% decrease from down 1.0% reported before. There were also sizable gains in August at furniture stores, up 0.9% (+4.9% y/y), electronics & appliance stores, up 0.8% (+3.1% y/y) and miscellaneous stores, up 1.0% (+4.2% y/y). So several durable goods sectors had firm performances in the latest period. At the same time, building materials, supplies and hardware sales retreated 0.9% (+7.6% y/y) following their 1.8% surge in July.
Gasoline service station sales were flat in August (-1.5% y/y) as pump prices edged lower. The sales total excluding gas stations, building materials and motor vehicle dealers is used in calculating gross domestic product, and that "excluding" subset edged up 0.1% last month (+3.5% y/y) after a 0.5% gain in July and 0.4% in June.
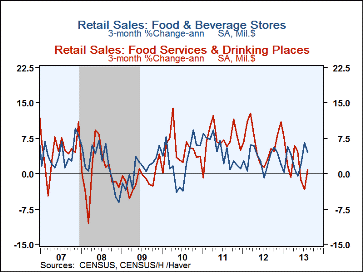
Other nondurable-type sales were mixed. Health and personal care stores saw a 0.6% gain in August (+3.6% y/y), as did department stores, in their first gain since January (-5.3% y/y). But clothing store sales fell 0.8% (+3.6% y/y) and general merchandise stores other than department stores were weak enough to push total general merchandise outlets down 0.2% (+0.3% y/y). Food & beverage store sales increased 0.1% (3.6% y/y). Restaurant sales rose 0.3% (+3.8% y/y) and spending at nonstore retailers rose 0.5% (10.2% y/y) after 1.3% in both July and June.
The retail sales figures are available in Haver's USECONdatabase. The Action Economics figures are in the AS1REPNAdatabase.
| Retail Spending (%) | Aug | Jul | Jun | Aug Y/Y | 2012 | 2011 | 2010 |
|---|---|---|---|---|---|---|---|
| Total Retail Sales & Food Services | 0.2 | 0.4 | 0.7 | 4.7 | 5.3 | 7.5 | 5.5 |
| Excluding Autos | 0.1 | 0.6 | 0.2 | 3.3 | 4.8 | 7.0 | 4.5 |
| Non-Auto Less Gasoline & Building Supplies | 0.2 | 0.5 | 0.2 | 3.6 | 4.3 | 5.4 | 3.5 |
| Retail Sales | 0.2 | 0.4 | 0.8 | 4.8 | 5.0 | 7.7 | 5.8 |
| Motor Vehicle & Parts | 0.9 | -0.5 | 2.7 | 10.9 | 7.5 | 10.1 | 10.6 |
| Retail Less Autos | 0.0 | 0.7 | 0.3 | 3.2 | 4.4 | 7.1 | 4.6 |
| Gasoline Stations | 0.0 | 0.7 | 0.7 | -1.5 | 4.0 | 18.4 | 14.6 |
| Food Service & Drinking Places Sales | 0.3 | 0.5 | -0.6 | 3.8 | 7.2 | 6.0 | 3.2 |
Carol Stone, CBE
AuthorMore in Author Profile »Carol Stone, CBE came to Haver Analytics in 2003 following more than 35 years as a financial market economist at major Wall Street financial institutions, most especially Merrill Lynch and Nomura Securities. She had broad experience in analysis and forecasting of flow-of-funds accounts, the federal budget and Federal Reserve operations. At Nomura Securities, among other duties, she developed various indicator forecasting tools and edited a daily global publication produced in London and New York for readers in Tokyo. At Haver Analytics, Carol was a member of the Research Department, aiding database managers with research and documentation efforts, as well as posting commentary on select economic reports. In addition, she conducted Ways-of-the-World, a blog on economic issues for an Episcopal-Church-affiliated website, The Geranium Farm. During her career, Carol served as an officer of the Money Marketeers and the Downtown Economists Club. She had a PhD from NYU's Stern School of Business. She lived in Brooklyn, New York, and had a weekend home on Long Island.
More Economy in Brief
 Global| Feb 05 2026
Charts of the Week: Balanced Policy, Resilient Data and AI Narratives
by:Andrew Cates


