 Global| Sep 12 2008
U.S. Retail Sales Weak: A Broad-Based Decline
by:Tom Moeller
|in:Economy in Brief
Summary
The Commerce Department reported that August retail sales fell 0.3%. The decline followed a revised 0.5% July drop that was deeper than reported initially. The June sales figures also were revised weaker. On a three-month basis [...]
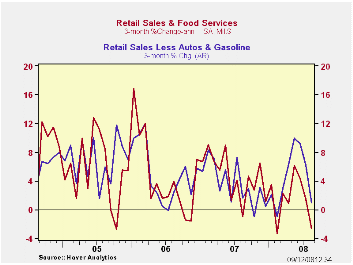
The Commerce Department reported that August retail sales fell 0.3%. The decline followed a revised 0.5% July drop that was deeper than reported initially. The June sales figures also were revised weaker. On a three-month basis overall retail sales fell 1.7% (AR) and that was down from last year's 4.1% increase. The August decline compared to a Consensus expectation for a 0.3% increase.
Lower gasoline prices played a roll in the decline in last month's sales figure. Sales at gasoline service stations fell 2.5% (+22.5% y/y). That followed a 0.2% uptick in July as well as gains of 4.0% and 3.3% during the prior two months.
To an extent, gasoline sales' weakness was offset by a 1.9% increase in sales of motor vehicles & parts. That recovered nearly half of the July shortfall but sales remained down 13.5% y/y. Sales fell at an 18.8% annual rate during the last three months.
Retail sales excluding autos fell 0.7% in
August, a decline deeper than Consensus expectations of a 0.2%
shortfall.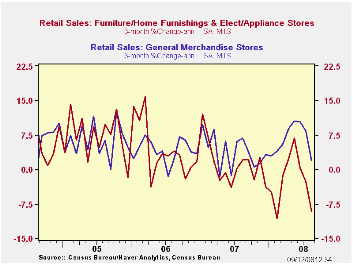
Sales excluding gasoline & autos also were down. The 0.4% (+3.2% y/y) drop reversed all of the July increase. It also weakened growth on a three-month basis to a 1.0% annual rate. That represents sharp deceleration from the six-to-ten percent growth in place since April.
Sales offurniture, home furnishings & appliances fell for the third straight month, down by 0.7% (-2.9% y/y). Sales of electronics & appliances fell 1.3% (+1.2% y/y). Sales of furniture & home furnishings stabilized a bit and they were unchanged m/m (-6.8% y/y). Apparel store sales also were weak and the 0.3% (+1.2% y/y) decline reversed the July increase. General merchandise store sales also fell. The 0.2% dip reversed a modest July gain and it reduced the three-month growth rate to 1.8% from 10%+ just a few months ago.
Sales of building materials and garden equipment added to the weakness as they fell 2.2% (-2.7% y/y).
Purchases made from home also were quite weak. Sales of nonstore retailers (internet & catalogue) dropped 2.3% (+6.1% y/y) and that followed a rise of just 0.8% during July. Three-month growth in these sales fell to -3.9% (AR).
Yesterday's comments by Fed Vice ChairmanDonald L. Kohn at the Brookings Panel on Economic Activity, Washington, D.C. can be found here.
| August | July | Y/Y | 2007 | 2006 | 2005 | |
|---|---|---|---|---|---|---|
| Retail Sales & Food Services (%) | -0.3 | -0.5 | 1.6 | 4.0 | 5.8 | 6.4 |
| Excluding Autos | -0.7 | 0.3 | 5.5 | 4.4 | 6.8 | 7.5 |
| Less Gasoline | -0.4 | 0.4 | 3.2 | 4.1 | 6.2 | 6.4 |
by Tom Moeller September 12, 2008
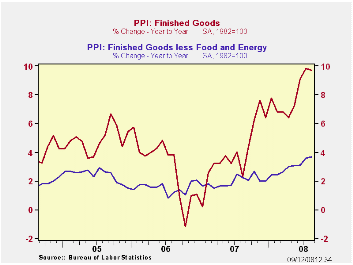
U.S. finished producer prices declined 0.9% during July following a revised 1.2% increase during June. The decline was roughly double Consensus expectations for a 0.5% drop.
Lower energy prices pulled the overall PPI down with a 4.6% (+27.4% y/y) drop. Gasoline prices fell 3.5% but they remained up by nearly one half from July of last year. Natural gas prices also fell by 5.0% (+25.4% y/y). Residential electric power costs inched up 0.1% (+6.2% y/y).
For the second consecutive month finished consumer food prices
rose 0.3% (9.2% y/y). Beef and veal broke out to the upside with a 1.6%
(19.0% y/y) rise on the heels of a 7.4% July jump. Pork prices also
were quite strong with a 10.1% (10.2% y/y) jump. Countering some of
this strength was a 1.2% (+0.1% y/y) decline in dairy product prices
and though fresh vegetable prices fell 14.3%, they remained up (9.6%
y/y). Finally, prices for pasta products inched up just 0.1% but
they're up 39.8% y/y.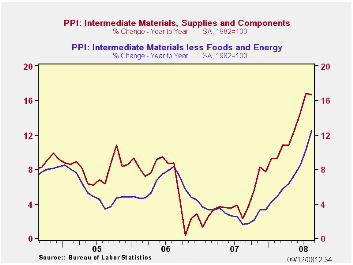
Less food & energy the gain in prices eased to 0.2% after the 0.7% jump during July. The latest figure matched expectations. The momentum in core producer prices has, however, picked up. The 3.7% y/y increase is the strongest since early-1991. Prices of core finished consumer goods rose 0.2% and that lifted y/y growth in these prices to 4.0%, the strongest gain in ten years. Durable consumer goods prices fell 0.1% (+2.0% y/y) but core nondurable goods prices rose 0.6% (5.6% y/y) for the second consecutive month. Finally, though capital equipment prices inched up just 0.1%, that followed a 0.8% jump during July and the 3.2% y/y increase was the strongest since 1991.
Intermediate goods prices fell 1.0% with lower energy prices. That reversed some of the prior month's 2.7% rise. Excluding food & energy, however, these prices remained firm and they posted a 1.7% increase. The y/y gain of 12.5% was the strongest since 1980.
The crude materials PPI flopped 11.9% (+38.2% y/y) due to a 19.4% drop in energy prices. However, these prices still are up by more than one half year-to-year. Crude food prices fell 5.2% (+15.2% y/y). Less food & energy crude prices fell all of 1.9%. While that reversed most of the 3.4% July increase, the year-to-year gain of 33.5% is a near-record rise.
| Producer Price Index (%) | August | July | Y/Y | 2007 | 2006 | 2005 |
|---|---|---|---|---|---|---|
| Finished Goods | -0.9 | 1.2 | 9.7 | 3.9 | 3.0 | 4.9 |
| Core | 0.2 | 0.7 | 3.7 | 1.9 | 1.5 | 2.4 |
| Intermediate Goods | -1.0 | 2.7 | 16.7 | 4.1 | 6.4 | 8.0 |
| Core | 1.7 | 2.0 | 12.5 | 2.8 | 6.0 | 5.5 |
| Crude Goods | -11.9 | 4.2 | 38.2 | 12.1 | 1.4 | 14.6 |
| Core | -1.9 | 3.4 | 33.5 | 15.6 | 20.8 | 4.9 |
by Tom Moeller September 12, 2008
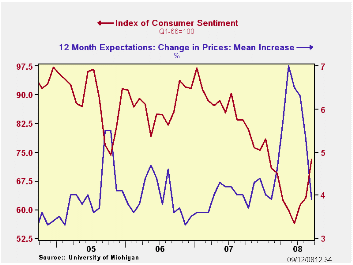
The University of Michigan's reading of consumer sentiment in mid-September jumped 16.0% from August to an index level of 73.1. That was the highest level since January and the gain contrasted with Consensus expectations for a reading of 64.0.
During the last ten years there has been a 47% correlation between the level of sentiment and the three-month change in real consumer spending.
The mean expected rate of inflation during the next year dropped to 3.9% with lower oil prices. It was as high as 7.0% in May. During the next five years the expected inflation rate fell to 3.1%, the lowest level since mid-2005.
The expectations component of consumer sentiment led the
increase in the total with a 22.5% spike, but the rise still left the
reading down slightly from one year ago. Expectations for business
conditions during the next year jumped yet they remained lower than
last year. Expectations for conditions during the next five years rose
firmly to their highest in a year.The expected change in personal
finances also recovered to their highest level in one year.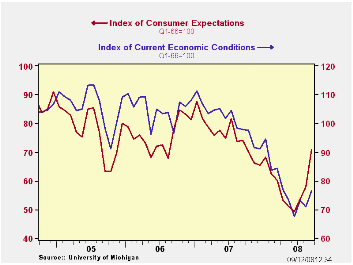
The current conditions index rose a more moderate 7.7% for the month to the highest level since April. The view of current personal finances rose the highest level since May but the sense of buying conditions for large household goods was unchanged, down 23.6% y/y.
The opinion of government policy, which apparently influences economic expectations, rose slightly from August (-27.8% y/y). Only six percent of respondents thought that a good job was being done by government, an unchanged reading since May.
The University of Michigan survey is not seasonally adjusted.The reading is based on telephone interviews with about 500 households at month-end; the mid-month results are based on about 300 interviews. The summary indexes are in Haver's USECON database, with details in the proprietary UMSCA database.
| University of Michigan | Mid-September | August | July | Sept. y/y | 2007 | 2006 | 2005 |
|---|---|---|---|---|---|---|---|
| Consumer Sentiment | 73.1 | 63.0 | 61.2 | -12.4% | 85.6 | 87.3 | 88.5 |
| Current Conditions | 76.5 | 71.0 | 73.1 | -21.9% | 101.2 | 105.1 | 105.9 |
| Expectations | 70.9 | 57.9 | 53.5 | -4.3% | 75.6 | 75.9 | 77.4 |
by Robert Brusca September 12, 2008
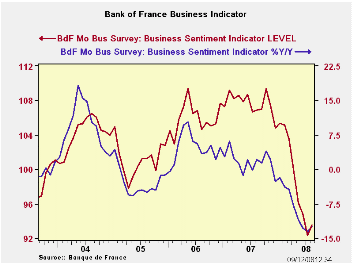
The BOF indicator has been weak and it has been weakening. But in August the indicator put on the brakes, and actually rebounded. While every other EMU country is cutting, chopping or shaving its forecast the BoF has held firm on its outlook armed with this tiny rebound in the context of a steep downtrend in the index.
The BoF projects Q3 growth at 0.1%. The survey points to some slight increase in activity but trends have been diminishing. All readings in the industry survey are below their historic averages. The overall industry index resides in the 13th percentile of its range of values since 1987. Production outlook responses are in the bottom 25 percentile of their ranges. All industries’ production outlooks are weak except for capital goods which amazingly continues to reside in the 88th percentile of its historic range. Consumer goods, in contrast, are in the bottom 14 percentile of their range agriculture and food industries are in the bottom 8 percentile of their ranges.
Order books are weak. Both raw readings slipped this month. For total orders the series resides in about the bottom third of its range. But foreign orders are much weaker and are now in the bottom 5 percentile of their historic range. New orders are also weak month to month.
It is the production outlook and production in the current month readings that have improved in this August survey. This is a current activity series and another based on plans. But if actual orders are so much weaker and if order books are emaciated, why are plans for output so strong? The BoF survey still raises a lot of questions about France’s optimism.
| Bank of France Monthly INDUSTRY Survey | ||||||
|---|---|---|---|---|---|---|
| 12 MO | Since Jan-87 | Ranking | ||||
| Aug-08 | Jul-08 | Jun-08 | AVERAGE | Average | Percentile | |
| Production-latest mo | ||||||
| Total Industry | 4.69 | 2.09 | 0.45 | 3 | 7 | 30.6% |
| Semi-Finished | 4.84 | -4.1 | -0.76 | 2 | 5 | 44.1% |
| Capital | 1.1 | 5.58 | 9.98 | 6 | 7 | 21.2% |
| Auto | 7.76 | 6.32 | -22.28 | -3 | 8 | 53.1% |
| Consumer | 8.42 | 4.48 | 10.68 | 6 | 8 | 50.2% |
| Agric&Food | 5.42 | 1.41 | -0.74 | 4 | 10 | 22.9% |
| Production Outlook | ||||||
| Total Industry | 2.75 | -5.71 | 1.82 | 5 | 7 | 15.5% |
| Semi-Finished | 0.23 | -4.78 | -2.79 | 4 | 6 | 18.4% |
| Capital | 14.98 | 0.54 | 7.8 | 9 | 7 | 88.2% |
| Auto | 3.75 | -13.05 | 10.62 | 14 | 14 | 25.7% |
| Consumer | 10.46 | -3.55 | 8.72 | 9 | 16 | 14.3% |
| Agric&Food | 8.83 | 6.95 | 7.96 | 11 | 16 | 7.8% |
| Demand | ||||||
| Overall order books | -1.63 | 2.6 | 5.36 | 17 | 4 | 36.7% |
| Foreign Orders | -6.91 | -4 | -5.55 | 4 | 8 | 4.9% |
| New Orders | ||||||
| Total Industry | -3.24 | 0.26 | -3.39 | 5 | 8 | 8.2% |
| Semi-Finished | -1.19 | -3.42 | -2.03 | 3 | 7 | 19.6% |
| Capital | 1.86 | 12.92 | -6.11 | 7 | 9 | 24.1% |
| Auto | ||||||
| Consumer | 10.37 | 10.5 | 9.69 | 11 | 11 | 44.1% |
| Agric&Food | -12.21 | 2.72 | -5.94 | 2 | 10 | 0.8% |
| Stocks: Finished Gds | ||||||
| Total Industry | -1.59 | 0.09 | 0.54 | -2 | -2 | 55.9% |
| Semi-Finished | -2.72 | -0.14 | 3.49 | -2 | -2 | 37.1% |
| Capital | 3.8 | 0.94 | 2.08 | -1 | -3 | 95.5% |
| Auto | -18.44 | 6.36 | -11.74 | -5 | -3 | 13.5% |
| Consumer | -3.48 | -0.17 | -0.3 | -1 | 0 | 18.0% |
| Agric&Food | 1.57 | -1.82 | 3.11 | 1 | 0 | 59.6% |
| Capacity Utilization | 80.72 | 81.17 | 81.51 | 83 | 83 | 9.8% |
| Hiring | ||||||
| Latest Mo | -2.82 | -3.37 | -2.47 | -1 | -1 | 44.9% |
| Outlook | -4.52 | -5.48 | -3.62 | -2 | -3 | 73.5% |
| Industry Sentiment Index | 93.55 | 92.35 | 94.86 | 102 | 104 | 13.9% |
| Ranges, percentiles since January of 1988. | ||||||
by Robert Brusca September 12, 2008
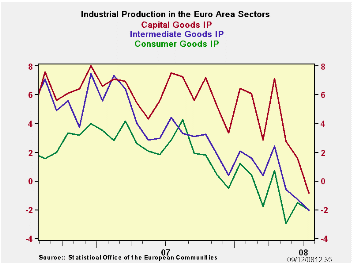
E-zone industrial output is down for three months running. All sectors are lower m/m in July. Main EU/EMU countries have output lower in July with France and Spain as exceptions. But over three months all these large countries are showing output trends lower and from 12 months to 6 months to 3 months output trends are accelerating in a negative direction across all these countries. The trend in the e-Zone is quite clear.
In the quarter to date output is falling in each of the large EU countries, except Spain, where output is extremely volatile. For all of EMU the decline is at a 6.6% negative annual rate. Germany and Italy are seeing the most extreme weakness early in Q3.
| E-zone MFG IP | ||||||||||
|---|---|---|---|---|---|---|---|---|---|---|
| Saar except m/m | Mo/Mo | Jul 08 |
Jun 08 |
Jul 08 |
Jun 08 |
Jul 08 |
Jun 08 |
|||
| Ezone Detail | Jul 08 |
Jun 08 |
May 08 |
3Mo | 3Mo | 6mo | 6mo | 12mo | 12mo | Q-2- Date |
| MFG | -0.5% | -0.3% | -1.5% | -8.5% | -5.4% | -5.0% | -2.2% | -1.9% | -0.6% | -6.6% |
| Consumer | -0.2% | 0.6% | -2.0% | -6.3% | -2.2% | -4.3% | -2.3% | -2.0% | -1.5% | -2.8% |
| C-Durables | -0.9% | 0.4% | -3.4% | -14.6% | -4.3% | -7.8% | -2.8% | -5.4% | -4.5% | |
| C-Nondurables | -0.3% | 0.7% | -1.5% | -4.3% | -2.4% | -3.7% | -2.1% | -1.4% | -0.8% | |
| Intermediate | -0.3% | -0.4% | -1.5% | -8.4% | -6.2% | -4.6% | -2.7% | -2.1% | -1.3% | -6.1% |
| Capital | -0.8% | -0.5% | -2.1% | -12.8% | -2.1% | -5.5% | 0.4% | -0.9% | 1.6% | -10.6% |
| Main E-zone Countries and UK IP in MFG | ||||||||||
| Mo/Mo | Jul 08 |
Jun 08 |
Jul 08 |
Jun 08 |
Jul 08 |
Jun 08 |
||||
| MFG Only | Jul 08 |
Jun 08 |
May 08 |
3Mo | 3Mo | 6mo | 6mo | 12mo | 12mo | Q-2- Date |
| Germany: | -2.0% | 0.5% | -1.9% | -13.1% | -6.9% | -7.8% | -2.2% | -0.2% | 2.2% | -13.3% |
| France: IP ex Construction | 1.2% | -0.6% | -3.0% | -9.5% | -8.5% | -3.8% | -5.3% | -2.0% | -1.9% | -1.5% |
| Italy | -1.5% | 0.0% | -1.8% | -12.3% | -4.9% | -5.8% | 0.4% | -4.1% | -2.4% | -11.8% |
| Spain | 10.4% | -5.1% | -14.8% | -36.7% | 13.0% | -5.9% | -17.9% | -2.7% | -9.8% | 3.6% |
| UK | -0.2% | -0.5% | -0.4% | -4.1% | -4.1% | -3.0% | -1.9% | -1.4% | -1.5% | -3.8% |

Tom Moeller
AuthorMore in Author Profile »Prior to joining Haver Analytics in 2000, Mr. Moeller worked as the Economist at Chancellor Capital Management from 1985 to 1999. There, he developed comprehensive economic forecasts and interpreted economic data for equity and fixed income portfolio managers. Also at Chancellor, Mr. Moeller worked as an equity analyst and was responsible for researching and rating companies in the economically sensitive automobile and housing industries for investment in Chancellor’s equity portfolio. Prior to joining Chancellor, Mr. Moeller was an Economist at Citibank from 1979 to 1984. He also analyzed pricing behavior in the metals industry for the Council on Wage and Price Stability in Washington, D.C. In 1999, Mr. Moeller received the award for most accurate forecast from the Forecasters' Club of New York. From 1990 to 1992 he was President of the New York Association for Business Economists. Mr. Moeller earned an M.B.A. in Finance from Fordham University, where he graduated in 1987. He holds a Bachelor of Arts in Economics from George Washington University.
More Economy in Brief


