 Global| Aug 13 2020
U.S. State Initial Claims Fall Below One Million; First Time Since March 14
Summary
• State initial jobless claims declined to 963,000 in the week ending August 8, the lowest level since March 14. • Federal Pandemic Unemployment Assistance new filers decreased to 488,622. • Continuing claims for state programs down [...]
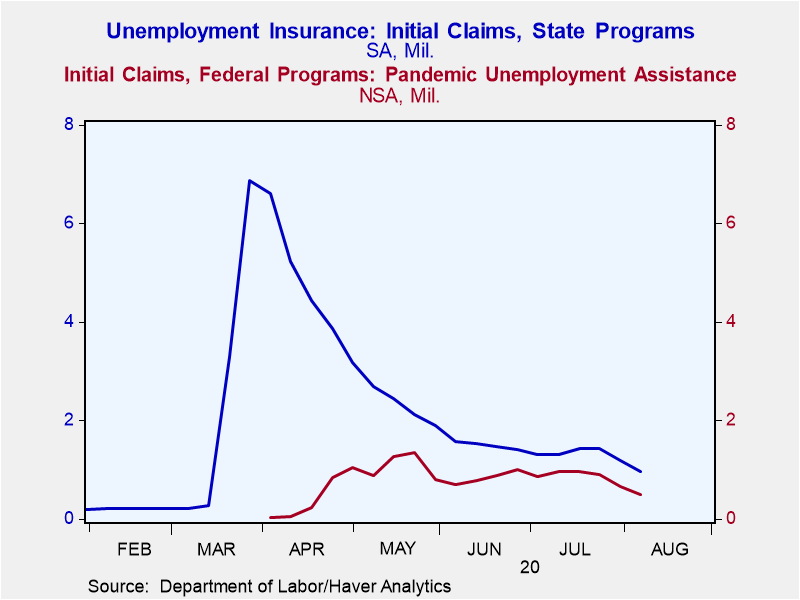
• State initial jobless claims declined to 963,000 in the week ending August 8, the lowest level since March 14.
• Federal Pandemic Unemployment Assistance new filers decreased to 488,622.
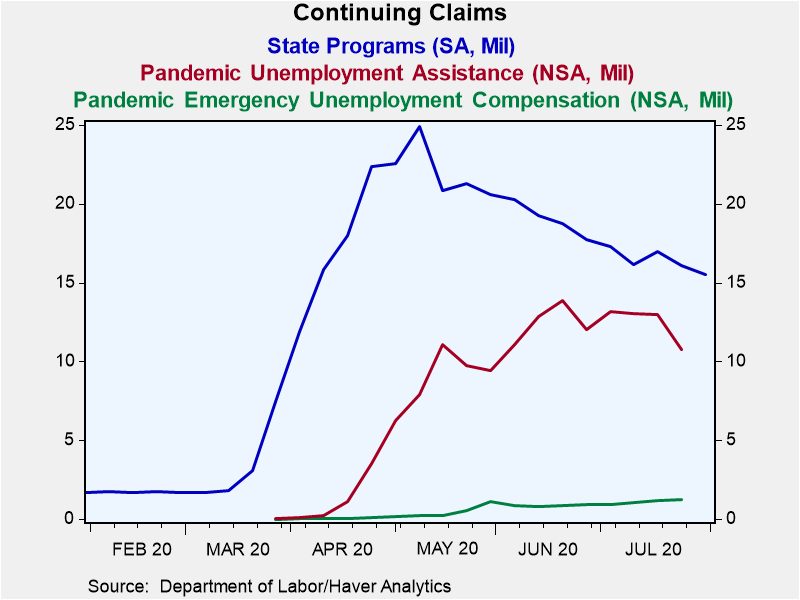
• Continuing claims for state programs down to 15.5 million; PUA drops to 10.7 million.
• Nineteen states had insured unemployment rates above 10%, Nevada and Hawaii remain above 20%.
State initial jobless claims for unemployment insurance decreased to 963,000 in the week ending August 8 from a slightly upwardly-revised 1.191 million (was 1.186 million). This is the first reading below one million since March 14. The current level of initial claims remains above the previous record of 695,000 set in 1982, however as a share of the labor force it is now below that level. The Action Economics Forecast Survey anticipated 1.2 million claims. The four-week moving average of initial claims, which smooths out week-to-week volatility, but is less important at the moment because of changing conditions, declined to 1.253 million from 1.339 million.
Claims for the federal Pandemic Unemployment Assistance (PUA) program, which covers individuals such as the self-employed who are not qualified for regular/state unemployment insurance, decreased to 488,622 in the week ending August 8 from a slightly downwardly-revised 655,999 (was 655,707). This is the lowest reading since the April 18. However, since the program was just ramping up and states had a backlog of claims, the actual number in mid-April may have been higher (PUA claims jumped to 608,093 to 833,083 in the next week). Numbers for this and other federal programs are not seasonally adjusted.
Continuing claims for unemployment insurance decreased to 15.486 million in the week ending August 1, from a downwardly-revised 16.090 million (was 16.107 million). Continuing PUA claims, which are lagged an additional week, fell to 10.723 million from an unrevised 12.956 million. Pandemic Emergency Unemployment Compensation claims increased to 1.224 million in the week ending July 25. This program covers people who were unemployed before COVID but exhausted their state benefits and are now eligible to receive an additional 13 weeks of unemployment insurance, up to a total of 39 weeks.
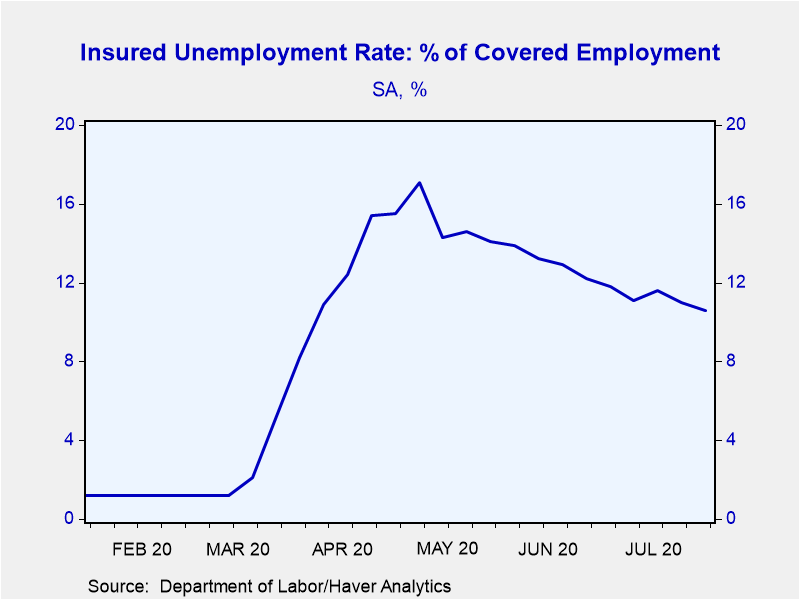
The insured rate of unemployment declined to 10.6% in the week ending August 1 from an unrevised 11.0%. This data does not include the federal pandemic assistance programs. If you include the latest data available, which is lagged one additional week, the number of continuing claims increased to 27.4 million or 17.2% of the labor force. This is the lowest level of total continuing claims since May 9.
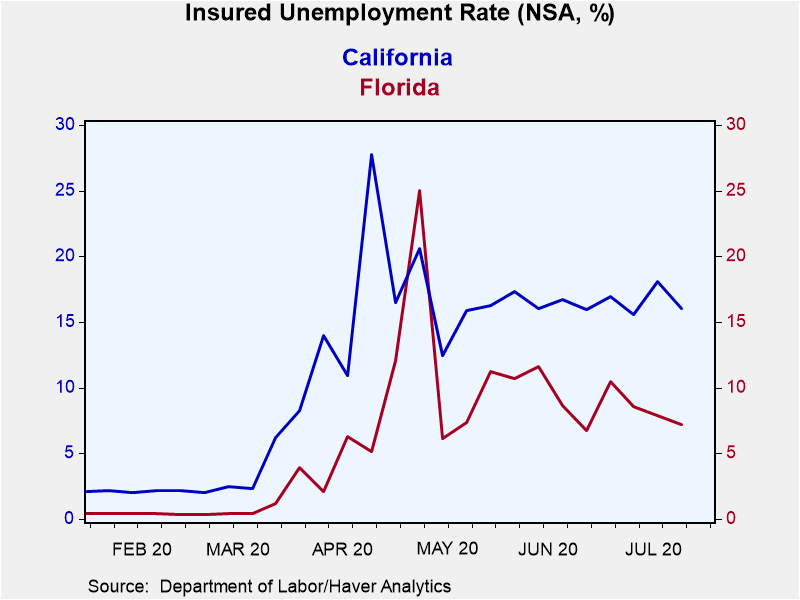
The state insured rates of unemployment -- which do not include federal programs -- continued to show wide variation with Idaho at just 3.4% and Nevada at 23.6%. Nevada has been above 20% for 14 consecutive weeks. Nineteen states had rates over 10% and Hawaii along with Nevada had a rate over 20%. The largest states ranged between 7.2% for Florida and 16.5% for New York. The state rates are not seasonally adjusted.
Data on weekly unemployment claims going back to 1967 are contained in Haver's WEEKLY database, and they are summarized monthly in USECON. Data for individual states are in REGIONW. The expectations figure is from the Action Economics Forecast Survey, carried in the AS1REPNA database.
| Unemployment Insurance (SA, 000s) | 08/08/20 | 08/01/20 | 07/25/20 | Y/Y % | 2019 | 2018 | 2017 |
|---|---|---|---|---|---|---|---|
| Initial Claims | 963 | 1,191 | 1,435 | 342 | 218 | 221 | 244 |
| 4-week Average | 1,253 | 1,339 | 1,369 | -- | -- | -- | -- |
| Initial Claims Pandemic Unemployment Assistance (NSA) | 489 | 656 | 909 | -- | -- | -- | -- |
| Continuing Claims | -- | 15,486 | 16,090 | 801 | 1,701 | 1,756 | 1,961 |
| 4-week Average | -- | 16,170 | 16,624 | -- | -- | -- | -- |
| Continuing Claims Pandemic Unemployment Assistance (NSA) | -- | -- | 10,723 | -- | -- | -- | -- |
| Insured Unemployment Rate (%) | -- | 10.6 | 11.0 |
1.2 |
1.2 | 1.2 | 1.4 |
Gerald D. Cohen
AuthorMore in Author Profile »Gerald Cohen provides strategic vision and leadership of the translational economic research and policy initiatives at the Kenan Institute of Private Enterprise.
He has worked in both the public and private sectors focusing on the intersection between financial markets and economic fundamentals. He was a Senior Economist at Haver Analytics from January 2019 to February 2021. During the Obama Administration Gerald was Deputy Assistant Secretary for Macroeconomic Analysis at the U.S. Department of Treasury where he helped formulate and evaluate the impact of policy proposals on the U.S. economy. Prior to Treasury, he co-managed a global macro fund at Ziff Brothers Investments.
Gerald holds a bachelor’s of science from the Massachusetts Institute of Technology and a Ph.D. in Economics from Harvard University and is a contributing author to 30-Second Money as well as a co-author of Political Cycles and the Macroeconomy.
More Economy in Brief
 Global| Feb 05 2026
Charts of the Week: Balanced Policy, Resilient Data and AI Narratives
by:Andrew Cates


