 Global| Nov 04 2020
U.S. Trade Deficit Narrowed in September
by:Sandy Batten
|in:Economy in Brief
Summary
• Exports up 2.6% m/m while imports edged up just 0.5%. • Exports led by jump in soybean shipments; slowdown in imports due mostly to softer imports of consumer goods and petroleum. The U.S. trade deficit in goods and services [...]
• Exports up 2.6% m/m while imports edged up just 0.5%.
• Exports led by jump in soybean shipments; slowdown in imports due mostly to softer imports of consumer goods and petroleum.
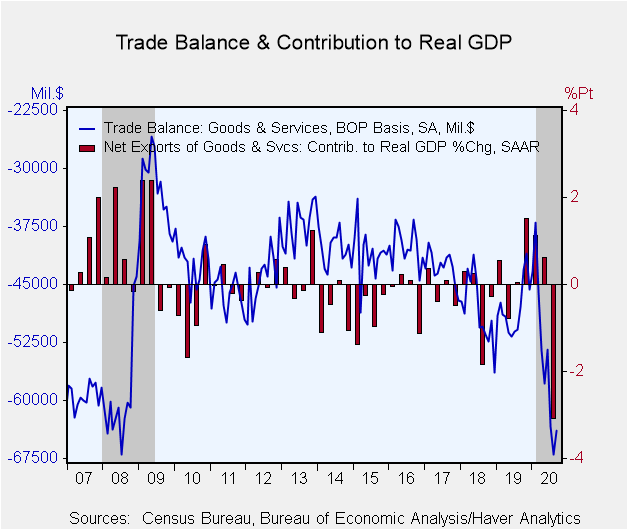
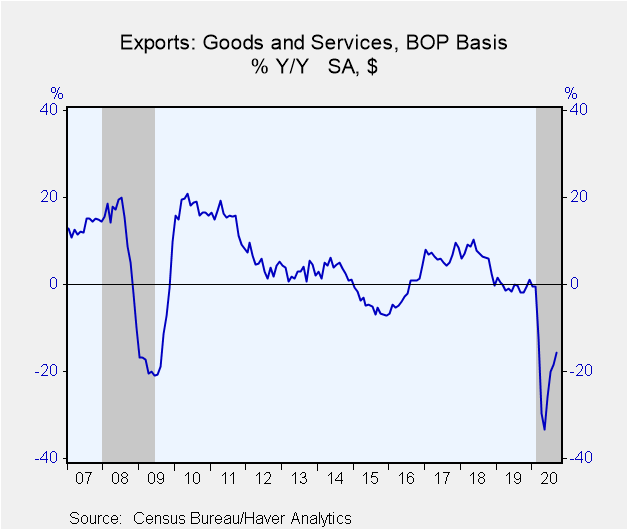
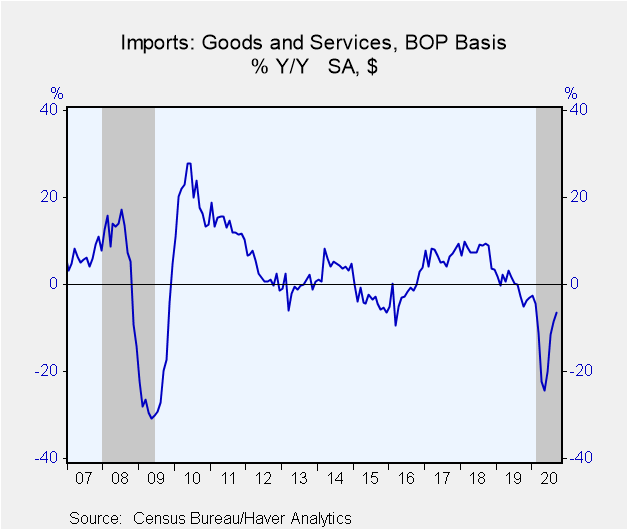
The U.S. trade deficit in goods and services narrowed in September to $63.9 billion from a slightly revised $67.0 billion in August (initially $67.1 billion). The Action Economics Forecast survey had looked for a deficit of $64.7 billion. Exports increased 2.6% m/m (-15.7% y/y) following a 2.2% monthly gain in August. Imports edged up only 0.5% m/m (-6.5% y/y) in September after rising 3.2% m/m in August.
The nominal deficit in goods trade narrowed to $80.7 billion from the record $83.8 billion recorded in August. The September reading was slightly larger than the $79.4 billion deficit in the advance report. Exports of goods increased 3.1% m/m (-9.8% y/y) versus 3.0% m/m in August. The September increase was led by to a 14.4% surge in exports of foods and feeds, which consisted mostly of a jump in soybean shipments (presumably to China), and a 3.8% m/m rise in exports of capital goods. Imports of goods rose just 0.3% m/m (-2.2% y/y) in September after a 3.3% m/m gain in August. Imports of autos and parts jumped up 11.3% m/m while imports of industrial supplies fell 3.5% m/m and imports of consumer goods declined 3.6% m/m. With their September increase, auto imports have now regained their pre-COVID level.
The real goods trade balance also narrowed in September--to $87.6 billion (2012$) from a record $92.4 billion in August. The widening real trade deficit in Q3 subtracted meaningfully from the rebound in GDP. The sharp narrowing in September sets the stage for some possible improvement in Q4.
The surplus on trade in services was essentially unchanged at $16.8 billion in September. Exports of services rose 1.3% m/m (-26.7% y/y) after having edged up 0.4% m/m in August, led by a 6.7% m/m increase in exports of maintenance and repair services. Exports of travel services, hit severely by the pandemic, posted their first monthly increase since February, rising 3.4% m/m but are still down 76.5% from a year ago. Imports of services rose 1.8% m/m (-25.0% y/y) following a 2.4% m/m increase in August. Rebounds in imports of travel and transportation accounted for most of the August increase.
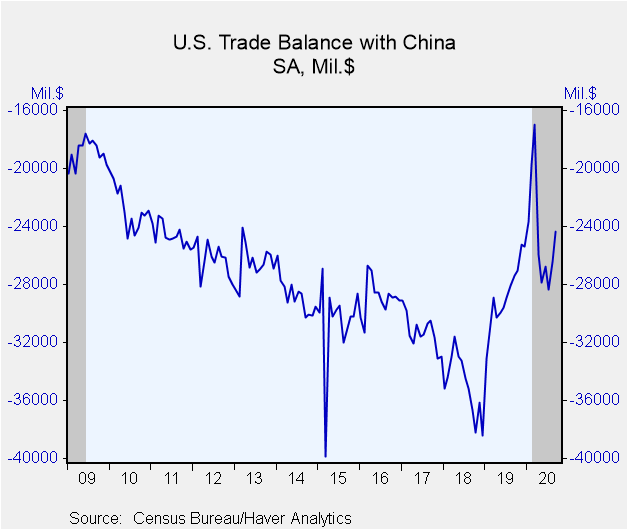
The seasonally adjusted goods trade deficit with China narrowed to $24.3 billion in September from $26.4 billion in August. Exports to China increased 7.1% m/m while imports fell 3.5% m/m. The SA trade deficit with the European Union widened to $17.3 billion in September from $15.7 billion. Exports rose 1.5% m/m while imports increased 5.4% m/m. The trade deficit with Japan widened to $5.7 billion from $4.3 billion in August. Exports fell 6.8% m/m while imports jumped up 10.1% m/m.
The international trade data, including relevant data on oil prices, can be found in Haver's USECON database. Detailed figures on international trade are available in the USINT database. The expectations figures are from the Action Economics Forecast Survey, which is carried in AS1REPNA.
| Foreign Trade in Goods & Services (Current $) | Sep | Aug | Jul | Sep Y/Y | 2019 | 2018 | 2017 |
|---|---|---|---|---|---|---|---|
| U.S. Trade Deficit ($ bil.) | 63.86 | 67.04 | 63.37 | 47.84 | 576.86 | 579.94 | 513.79 |
| Exports of Goods & Services (% Chg) | 2.6 | 2.2 | 8.3 | -15.7 | -0.4 | 6.4 | 6.7 |
| Imports of Goods & Services (% Chg) | 0.5 | 3.2 | 10.9 | -6.5 | -0.5 | 7.5 | 6.7 |
| Petroleum (% Chg) | 0.1 | 14.4 | 16.2 | -38.6 | -14.0 | 20.8 | 27.2 |
| Nonpetroleum Goods (% Chg) | 0.0 | 2.8 | 12.2 | 0.6 | -0.4 | 7.4 | 5.5 |
Sandy Batten
AuthorMore in Author Profile »Sandy Batten has more than 30 years of experience analyzing industrial economies and financial markets and a wide range of experience across the financial services sector, government, and academia. Before joining Haver Analytics, Sandy was a Vice President and Senior Economist at Citibank; Senior Credit Market Analyst at CDC Investment Management, Managing Director at Bear Stearns, and Executive Director at JPMorgan. In 2008, Sandy was named the most accurate US forecaster by the National Association for Business Economics. He is a member of the New York Forecasters Club, NABE, and the American Economic Association. Prior to his time in the financial services sector, Sandy was a Research Officer at the Federal Reserve Bank of St. Louis, Senior Staff Economist on the President’s Council of Economic Advisors, Deputy Assistant Secretary for Economic Policy at the US Treasury, and Economist at the International Monetary Fund. Sandy has taught economics at St. Louis University, Denison University, and Muskingun College. He has published numerous peer-reviewed articles in a wide range of academic publications. He has a B.A. in economics from the University of Richmond and a M.A. and Ph.D. in economics from The Ohio State University.


