 Global| Jul 06 2018
U.S. Trade Deficit Narrows in May
Summary
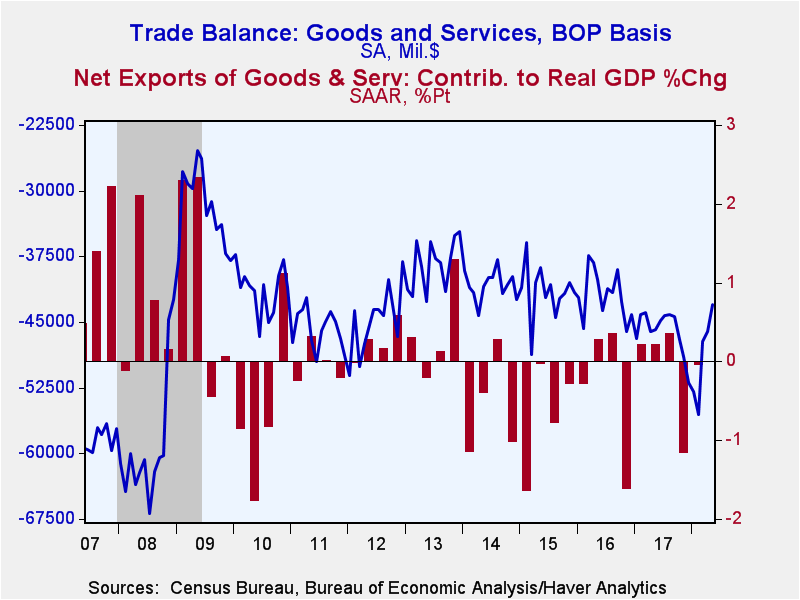
The U.S. trade deficit in goods and services fell to $43.1 billion in May from a slightly downwardly revised $46.1 billion during April. It was the smallest deficit since October 2016. A $43.9 billion deficit had been expected by the [...]
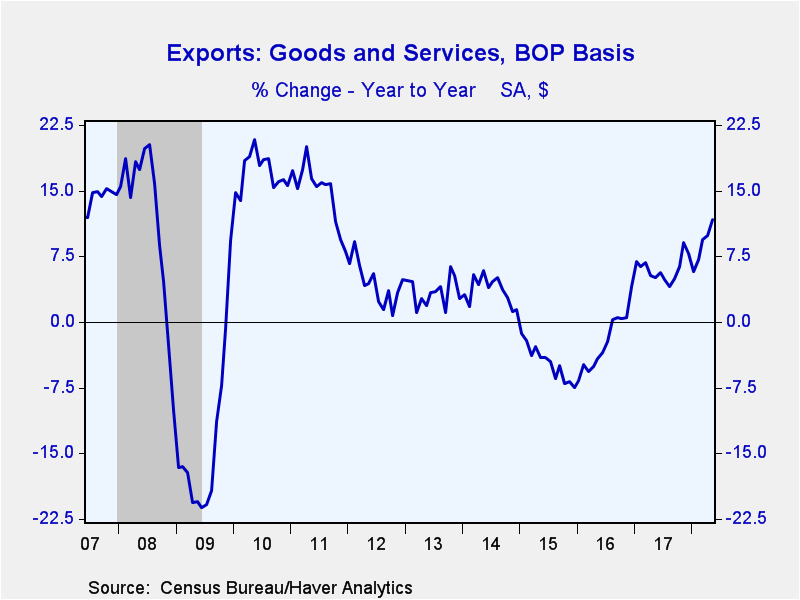
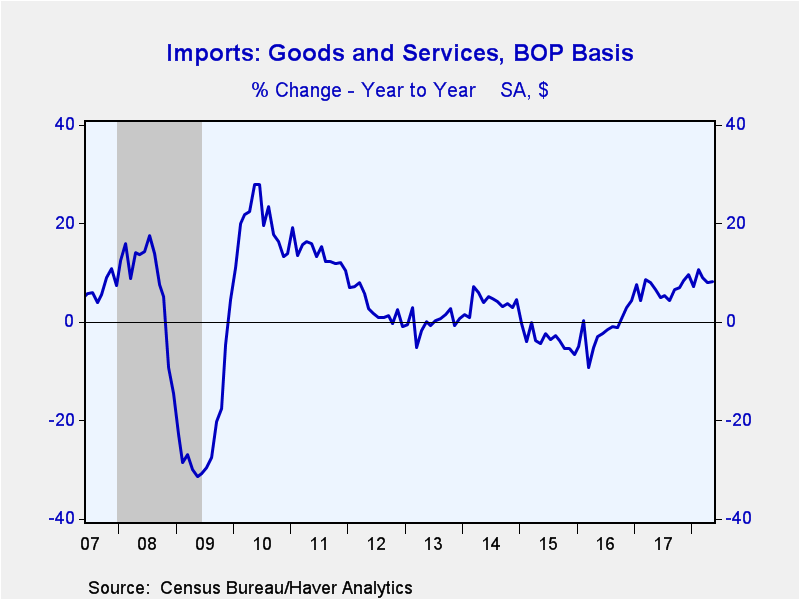
The U.S. trade deficit in goods and services fell to $43.1 billion in May from a slightly downwardly revised $46.1 billion during April. It was the smallest deficit since October 2016. A $43.9 billion deficit had been expected by the Action Economics Forecast Survey. Exports grew 1.9% month-on-month (11.7% year-on-year) following a 0.3% gain. Imports increased 0.4% (8.3% y/y) after edging down 0.2%.
Based on the data in hand it looks like trade will make a positive contribution to GDP growth in the second quarter. A narrower trade deficit had a modestly positive effect on real GDP growth in the first quarter following a large drag in Q4'17.
The deficit on goods trade narrowed to $65.8 billion in May from $68.4 billion. Exports of goods gained 2.6% (14.0% y/y) following a 0.2% rise. Foods, feeds & beverages jumped 14.1% (28.6% y/y), while capital goods rose 4.4% (11.2% y/y). Non-auto consumer goods exports gained 3.4% (5.8% y/y). Meanwhile, exports of industrial supplies and materials fell 2.8% (+18.0% y/y) and vehicles dropped 2.6% (+5.3% y/y).
Imports of goods rose 0.5% (8.7% y/y) in May following a 0.3% decline. Capital goods grew 3.6% (12.2% y/y) and foods, feeds & beverages increased 0.9% (8.4% y/y). Imports of industrial supplies were unchanged (+14.5% y/y) while automotive decreased 1.0% (+1.5% y/y) and non-auto consumer goods deteriorated 0.9% (+4.3% y/y).
Non-petroleum goods imports rose 0.6% (7.5% y/y) after a 0.9% decline. Petroleum imports shrunk 0.7% (+21.5% y/y) following a 5.0% increase. The per-barrel cost of crude oil rose to $58.37 (29.6% y/y), the highest price since January 2015. The value of energy-related petroleum product imports jumped 10.7% (22.4% y/y) while the quantity of energy-related product imports increased 1.6% (-8.6% y/y).
The surplus on services trade widened to $22.7 billion in May from $22.3 billion. Services exports increased 0.6% (7.2% y/y) after a 0.5% gain. The largest categories of service exports all grew with: travel 0.2% (2.9% y/y); non-financial or tech business services 0.6% (8.6% y/y), intellectual property 0.5% (5.3% y/y) and financial services 0.8% (12.0% y/y).
Imports of services edged down 0.1% (+6.6% y/y) after a 0.3% gain. U.S. residents' travel abroad declined 0.6% (+4.4% y/y). Imports of non-financial or tech business services rose 0.6% (11.2% y/y) while transport charges fell 1.1% (+4.2% y/y).
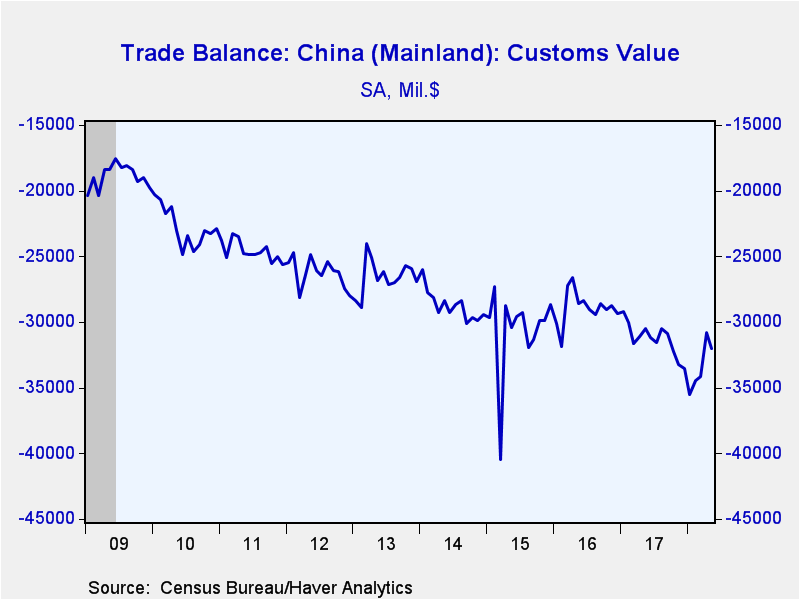
The goods trade deficit with China widened to $32.0 billion in May from $30.8 in April. Exports rose 7.6% y/y while imports were up 5.8% y/y. The deficit with the European Union narrowed to $11.9 billion from $13.2 billion with exports increasing 17.8% y/y and imports gaining 14.9% y/y. The trade deficit with Japan edged up to $6.0 billion from $5.9 billion as exports grew 19.8% y/y and imports expanded 6.3% y/y.
The international trade data can be found in Haver's USECON database. Detailed figures are available in the USINT database. The expectations figures are from the Action Economics Forecast Survey, which is carried in AS1REPNA.
| Foreign Trade in Goods & Services (Current $) | May | Apr | Mar | Y/Y | 2017 | 2016 | 2015 |
|---|---|---|---|---|---|---|---|
| U.S. Trade Deficit ($ bil.) | 43.05 | 46.08 | 47.21 | 45.82 (5/17) |
552.28 | 502.00 | 498.53 |
| Exports of Goods & Services (% Chg) | 1.9 | 0.3 | 2.2 | 11.7 | 6.1 | -2.2 | -4.6 |
| Imports of Goods & Services (% Chg) | 0.4 | -0.2 | -1.4 | 8.3 | 6.8 | -1.7 | -3.5 |
| Petroleum (% Chg) | -0.7 | 5.0 | -2.0 | 21.5 | 27.2 | -19.5 | -45.5 |
| Nonpetroleum Goods (% Chg) | 0.6 | -0.9 | -1.4 | 7.5 | 5.6 | -1.2 | 2.2 |
Gerald D. Cohen
AuthorMore in Author Profile »Gerald Cohen provides strategic vision and leadership of the translational economic research and policy initiatives at the Kenan Institute of Private Enterprise.
He has worked in both the public and private sectors focusing on the intersection between financial markets and economic fundamentals. He was a Senior Economist at Haver Analytics from January 2019 to February 2021. During the Obama Administration Gerald was Deputy Assistant Secretary for Macroeconomic Analysis at the U.S. Department of Treasury where he helped formulate and evaluate the impact of policy proposals on the U.S. economy. Prior to Treasury, he co-managed a global macro fund at Ziff Brothers Investments.
Gerald holds a bachelor’s of science from the Massachusetts Institute of Technology and a Ph.D. in Economics from Harvard University and is a contributing author to 30-Second Money as well as a co-author of Political Cycles and the Macroeconomy.
More Economy in Brief
 Global| Feb 05 2026
Charts of the Week: Balanced Policy, Resilient Data and AI Narratives
by:Andrew Cates


