 Global| Jan 04 2013
U.S. Vehicle Sales Edge Down in December; 2012 Volume Largest Since 2007
Summary
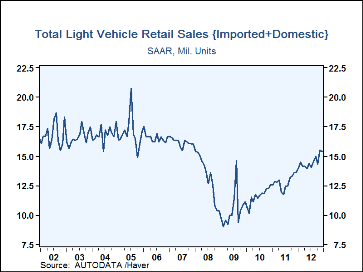
After their surge in November, unit sales of light motor vehicles eased 1.0% in December to 15.37M (SAAR, and 12.9% above December 2011) according to Autodata Corporation. The latest figure surpassed the Bloomberg survey consensus [...]
After their surge in November, unit sales of light motor vehicles eased 1.0% in December to 15.37M (SAAR, and 12.9% above December 2011) according to Autodata Corporation. The latest figure surpassed the Bloomberg survey consensus estimate for 15.1M sales. For all of 2012, light vehicle sales came to 14.48M, up 13.4% from 2011, the third successive double-digit percentage gain and the highest level since 16.16M in 2007.
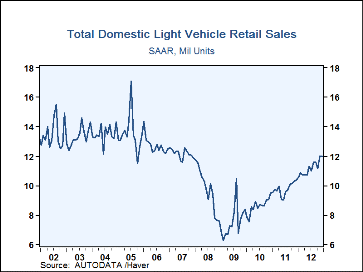
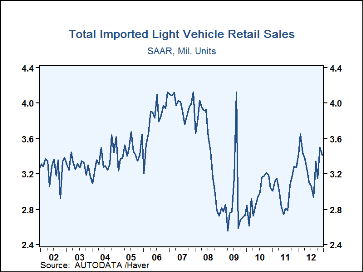
Auto sales were 7.88M, off 2.0% m/m (19.7% y/y) to 8.04M. Domestic models were 5.49M, down 1.1% m/m (+26.9% y/y) while imports were 2.40M, down 3.9% (+6.0% y/y). For the year, auto sales were 7.43M, up a significant 19.3% from 2011.
December's light truck sales edged down 0.1% to 7.49M (+6.6% y/y). Domestic light truck purchases were 6.48M, off 0.2% from November (+7.5% y/y) with imports up 1.0% to 1.01M, up 1.1% y/y. For the year, total light truck sales were 7.05M, up 7.7% from 2011.
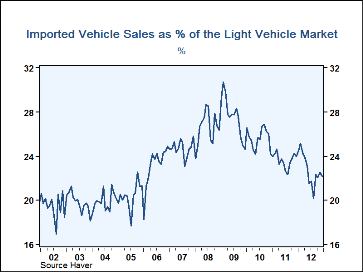
Imports' share of the U.S. light vehicle market pulled back just a bit to 22.2% last month from 22.5% in November. (Imported vehicles are those produced outside the United States.) That share was down from its peak of 29.9% in Q1'09. Imports' share of the U.S. car market eased to 30.4% from 31.0% in November, and imported light trucks gained to 31.0% but remained down from its 37.8% monthly peak in 2010. Imports' share of the light truck market was 13.5% last month, basically unchanged from 13.4% in November and down from its 23.9% peak in early '09.
The U.S. vehicle sales figures can be found in Haver's USECON database.
| Light Vehicle Sales (SAAR, Mil. Units) | |||||||
|---|---|---|---|---|---|---|---|
| Dec | Nov | Oct | Y/Y% | 2012 | 2011 | 2010 | |
| Total | 15.37 | 15.54 | 14.29 | 12.9 | 14.48 | 12.78 | 11.59 |
| Autos | 7.88 | 8.04 | 7.44 | 19.7 | 7.43 | 6.23 | 5.77 |
| Domestic | 5.49 | 5.55 | 5.16 | 26.9 | 5.10 | 4.21 | 3.76 |
| Imported | 2.40 | 2.49 | 2.28 | 6.0 | 2.33 | 2.02 | 2.01 |
| Light Trucks | 7.49 | 7.50 | 6.85 | 6.6 | 7.05 | 6.55 | 5.82 |
| Domestic | 6.48 | 6.49 | 5.98 | 7.5 | 6.08 | 5.55 | 4.86 |
| Imported | 1.01 | 1.00 | 0.87 | 1.1 | 0.97 | 1.00 | 0.96 |
Carol Stone, CBE
AuthorMore in Author Profile »Carol Stone, CBE came to Haver Analytics in 2003 following more than 35 years as a financial market economist at major Wall Street financial institutions, most especially Merrill Lynch and Nomura Securities. She had broad experience in analysis and forecasting of flow-of-funds accounts, the federal budget and Federal Reserve operations. At Nomura Securities, among other duties, she developed various indicator forecasting tools and edited a daily global publication produced in London and New York for readers in Tokyo. At Haver Analytics, Carol was a member of the Research Department, aiding database managers with research and documentation efforts, as well as posting commentary on select economic reports. In addition, she conducted Ways-of-the-World, a blog on economic issues for an Episcopal-Church-affiliated website, The Geranium Farm. During her career, Carol served as an officer of the Money Marketeers and the Downtown Economists Club. She had a PhD from NYU's Stern School of Business. She lived in Brooklyn, New York, and had a weekend home on Long Island.
More Economy in Brief
 Global| Feb 05 2026
Charts of the Week: Balanced Policy, Resilient Data and AI Narratives
by:Andrew Cates


