 Global| Oct 06 2017
U.S. Wholesale Inventories Rise in August, But Are Outpaced by Sales
by:Sandy Batten
|in:Economy in Brief
Summary
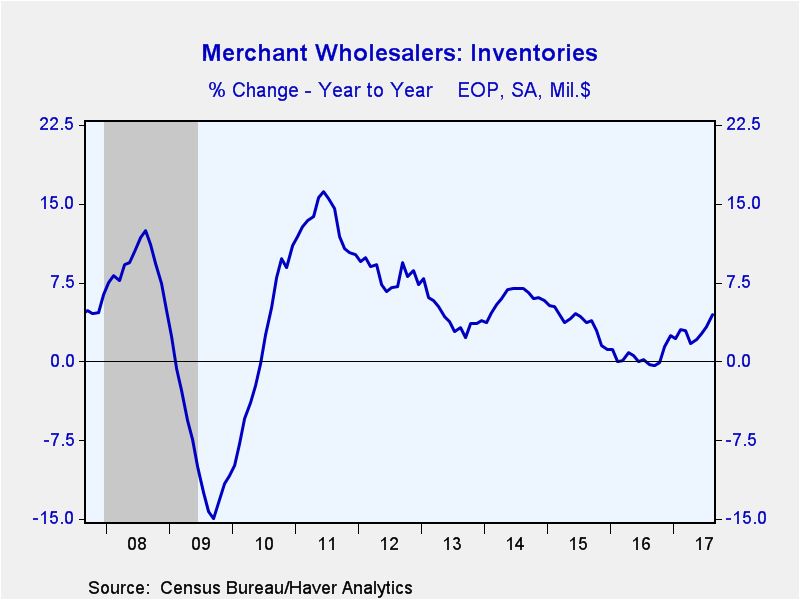
Inventories at the wholesale level rose 0.9% m/m (4.5% y/y) in August following unrevised 0.6% m/m increases in both July and June. Over the past three months, inventories are up at a 9.0% annual rate, up from 7.5% in July. Durable [...]
Inventories at the wholesale level rose 0.9% m/m (4.5% y/y) in August following unrevised 0.6% m/m increases in both July and June. Over the past three months, inventories are up at a 9.0% annual rate, up from 7.5% in July.
Durable goods inventories increased 0.8% (4.9% y/y), a slight slowdown from the 1.0% m/m rise in July. A 2.2% m/m (6.0% y/y) jump in automotive inventories and a 2.3% (9.4% y/y) rise in metals inventories led the overall August increase. Machinery inventories were unchanged in August (-0.2% y/y), while electrical and electronic goods inventories edged up just 0.1% m/m (9.6% y/y) after a 2.7% m/m surge in July. Inventories of nondurable goods jumped 1.2% m/m (3.8% y/y) in August after having been unchanged in July. A 3.7% m/m (4.2% y/y) surge in drug inventories led the overall August increase. Apparel inventories slumped 1.1% m/m (-7.5% y/y) and miscellaneous nondurable inventories were off 0.7% m/m (+9.1% y/y).
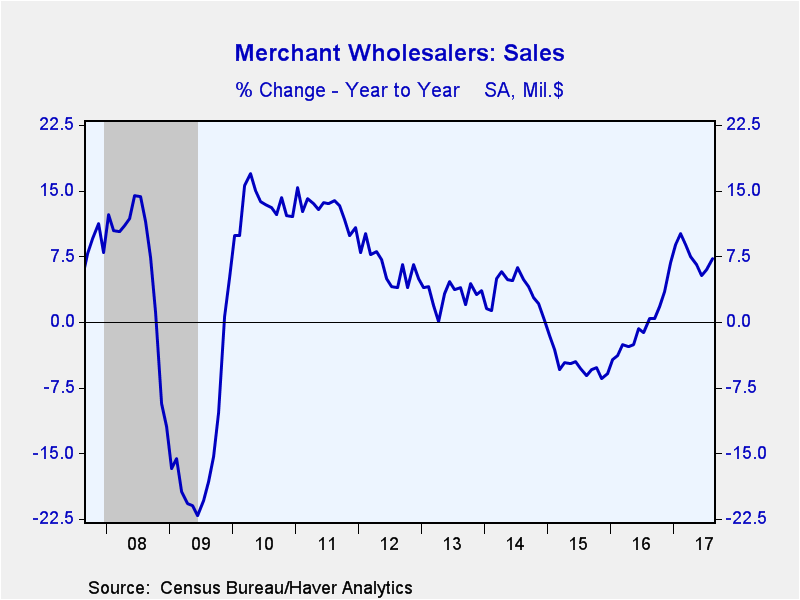
Wholesale sales outpaced inventories in August. Sales were up 1.7% m/m (7.2% y/y) after having been unchanged in July. Sales had slumped in the spring but have rebounded over the past several months. The August jump in sales was generally unexpected as the Action Economics Forecast Survey had looked for an unchanged reading.
Sales of both durable and nondurable goods were strong in August, with sales of durable goods slightly stronger. They were up 2.0% m/m (9.0% y/y), while sales of nondurable goods rose 1.5% m/m (5.6% y/y). The August increase in durable goods sales was widespread with a 4.9% m/m (12.1% y/y) surge in computer sales and a 4.2% m/m (13.3% y/y) jump in auto sales leading the August increase. In contrast, strength in nondurable goods sales in August was much narrower with most categories reporting small monthly declines. The overall increase was due mostly to a 6.1% m/m (19.5% y/y) jump petroleum sales and a 1.8% m/m (-6.7% y/y) rise in sales of farm products.
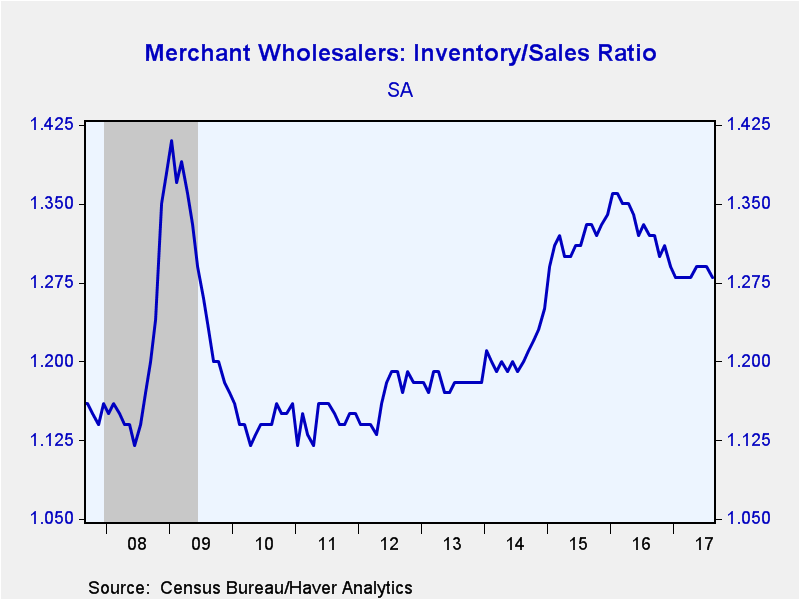
The wholesalers' inventory-to-sales ratio slipped in August to 1.28 from 1.29 in each of the previous three months. The August reading is well below that of a year ago and tied the low since December 2014.
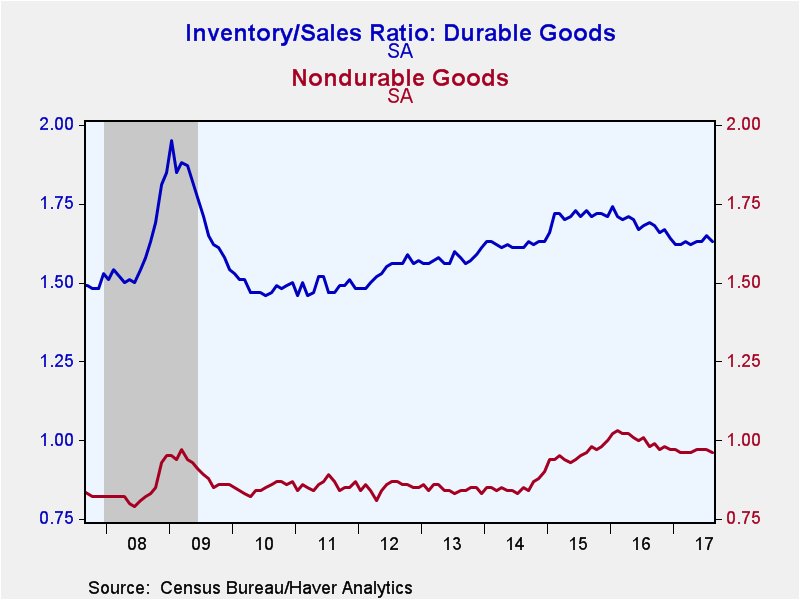
The durable goods I/S ratio slipped to 1.63 in August from 1.65 in July. This ratio has been relatively flat in 2017 after having fallen throughout 2016. The automotive I/S fell markedly in August to 1.76 notwithstanding the jump in inventories, which was surpassed by an even stronger rise in sales. The strong performance of computer sales led to a drop in its I/S ratio--to 0.85 from 0.88. While this ratio has generally declined during 2017, it remains elevated by historical standards. The nondurable goods I/S ratio slipped to 0.96 in August from 0.97 in July. The petroleum I/S continued its decline of the past two years, slipping to 0.40 in August from 0.42 in July.
The wholesale trade figures are available in Haver's USECON database. The Action Economic Survey results are contained in AS1REPNA.
| Wholesale Sector - NAICS Classification (%) | Aug | Jul | Jun | Aug Y/Y | 2016 | 2015 | 2014 |
|---|---|---|---|---|---|---|---|
| Inventories | 0.9 | 0.6 | 0.6 | 4.5 | 2.6 | 1.1 | 5.8 |
| Sales | 1.7 | 0.0 | 0.6 | 7.2 | -0.4 | -4.9 | 3.6 |
| I/S Ratio | 1.28 | 1.29 | 1.29 | 1.32 (Aug '16) | 1.33 | 1.32 | 1.21 |
Sandy Batten
AuthorMore in Author Profile »Sandy Batten has more than 30 years of experience analyzing industrial economies and financial markets and a wide range of experience across the financial services sector, government, and academia. Before joining Haver Analytics, Sandy was a Vice President and Senior Economist at Citibank; Senior Credit Market Analyst at CDC Investment Management, Managing Director at Bear Stearns, and Executive Director at JPMorgan. In 2008, Sandy was named the most accurate US forecaster by the National Association for Business Economics. He is a member of the New York Forecasters Club, NABE, and the American Economic Association. Prior to his time in the financial services sector, Sandy was a Research Officer at the Federal Reserve Bank of St. Louis, Senior Staff Economist on the President’s Council of Economic Advisors, Deputy Assistant Secretary for Economic Policy at the US Treasury, and Economist at the International Monetary Fund. Sandy has taught economics at St. Louis University, Denison University, and Muskingun College. He has published numerous peer-reviewed articles in a wide range of academic publications. He has a B.A. in economics from the University of Richmond and a M.A. and Ph.D. in economics from The Ohio State University.


