 Global| Apr 05 2007
UK House Prices Up 11% in March; Increase Is Especially Large in Northern Ireland
Summary
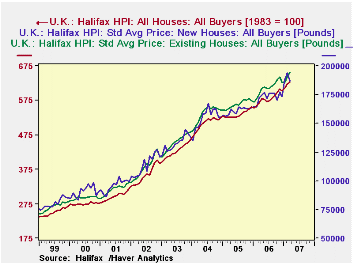
House prices are strong in the UK. Today's Halifax [HBOS] data show an 11.2% advance for March over a year ago, with a 1.1% rise in March alone. Both new and existing homes are experiencing the same general pattern, with new houses [...]

House prices are strong in the UK. Today's Halifax [HBOS] data show an 11.2% advance for March over a year ago, with a 1.1% rise in March alone. Both new and existing homes are experiencing the same general pattern, with new houses more erratic than existing, as seen in the graph.
 Compared with the overall US market, the behavior of new and existing homes varies. Clearly, current market conditions in the US are weaker and prices of both kinds of houses are flat to declining. Further, in the US new home prices run consistently higher than those on existing homes. But in the UK, the opposite can hold, and for considerable time. From the middle of 2004 through this past December new home prices were lower, generally by 3 to 5%, than existing home prices. UK homes appear to gain value in both an absolute sense and relative to new construction.
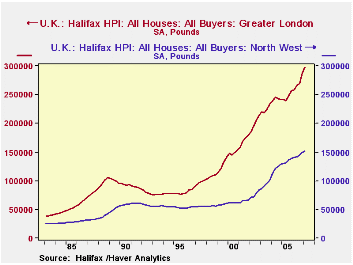
We're also fascinated by the array of regional information in the Halifax data. Prices are highest by far in London, as one might expect. Also, values are higher in the southern part of the country, in both South East and South West, than the national average. The South East includes Cambridge, Canterbury and Dover, among other well-known areas. The industrial north sees lower price levels, including North West, where Manchester is the biggest city, and Yorkshire.
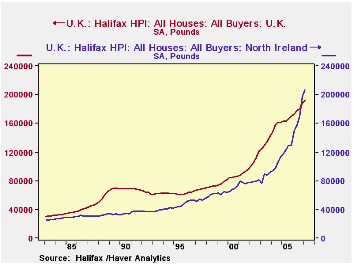
The improvement in the political situation in Northern Ireland has done wonders for its housing market. As seen in the table below and in the graph, prices there are now above the UK average, at over £200,000 during Q1. This latest is an increase over a year ago of 37%, and actually a "moderation" from the 53% gain during Q4 2006. Even over the past years of political tension, house prices in Northern Ireland managed to rise in fits and spurts, but obviously much more gradually than these recent substantial increases.
These data are in Haver's UK database and represent prices of standardized houses. The US data we compared are in USECON and are the median of actual selling prices for whatever combination of homes was sold in the specific time periods.
| Halifax House Prices: SA, £ | Mar 2007 | Feb 2007Jan 2007 | Year Ago | 2006 | 2005 | 2004 | ||
|---|---|---|---|---|---|---|---|---|
| United Kingdom | 194,362 | 192,349 | 188,826 | 174,814 | 179,175 | 165,310 | 156,980 | |
| Yr/Yr % Change | 11.2 | 11.0 | 10.4 | 7.4 | 8.3 | 5.3 | 18.8 | |
| Q1 2007 | Q4 2006 | -- | -- | -- | -- | |||
| Greater London | 297,132 | 287,737 | 258,605 | 270,458 | 246,149 | 242,072 | ||
| South East | 248,268 | 241,356 | 221,925 | 231,462 | 217,364 | 214,752 | ||
| North West | 151,341 | 149,914 | 141,445 | 144,658 | 133,502 | 121,758 | ||
| Yorkshire & the Humber | 145,419 | 144,564 | 134,709 | 139,213 | 126,578 | 114,960 | ||
| Northern Ireland | 206,495 | 197,086 | 150,808 | 168,696 | 124,803 | 102,570 | ||
Carol Stone, CBE
AuthorMore in Author Profile »Carol Stone, CBE came to Haver Analytics in 2003 following more than 35 years as a financial market economist at major Wall Street financial institutions, most especially Merrill Lynch and Nomura Securities. She had broad experience in analysis and forecasting of flow-of-funds accounts, the federal budget and Federal Reserve operations. At Nomura Securities, among other duties, she developed various indicator forecasting tools and edited a daily global publication produced in London and New York for readers in Tokyo. At Haver Analytics, Carol was a member of the Research Department, aiding database managers with research and documentation efforts, as well as posting commentary on select economic reports. In addition, she conducted Ways-of-the-World, a blog on economic issues for an Episcopal-Church-affiliated website, The Geranium Farm. During her career, Carol served as an officer of the Money Marketeers and the Downtown Economists Club. She had a PhD from NYU's Stern School of Business. She lived in Brooklyn, New York, and had a weekend home on Long Island.
More Economy in Brief
 Global| Feb 05 2026
Charts of the Week: Balanced Policy, Resilient Data and AI Narratives
by:Andrew Cates


