 Global| Aug 02 2005
UK's CBI Survey of Distributive Trades Confirms Slowdown in Retail Trade and Expects Continued Weakness
Summary
The results of the CBI (Confederation of British Industries) survey of the distributive trades released today show that the balance of opinion on the volume of retail sales improved minimally in July to -18 from -19 in June, the [...]

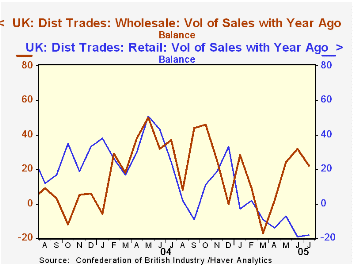
The results of the CBI (Confederation of British Industries) survey of the distributive trades released today show that the balance of opinion on the volume of retail sales improved minimally in July to -18 from -19 in June, the lowest figure since the survey began in 1983. Expectations of the volume of retail sales have caught up with the reported volumes and suggest that August will once again show only a minimal improvement to a balance of -17. The balance of reported sales volume for the retail sector has shown only one modest positive number--2 in February--since the beginning of the year.
There was more positive news for wholesale trade as can be seen in the first chart which shows the balance on reported sales volume for retail and wholesale trade. Although the balance on reported wholesale trade sales volume declined to 22 from 32 in June, the balance is significantly positive. Expected sales volume for August, however, are down to a positive 10. The balance on reported motor trade sales volume has been positive since May, but decreasing and the expected balance for August is once again negative at -4.
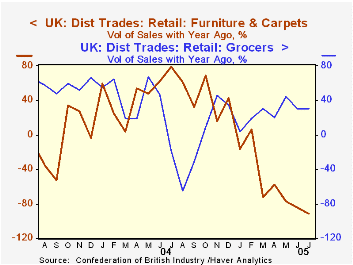
Balances of opinions on the annual growth of sales volume are also reported. In the most recent survey, Grocers showed the most positive results and Furniture and Carpet stores, the most dismal, as seen in the second chart.
The CBI Distributive Trades survey covers 20,000 outlets of firms responsible for 40% of employment in retailing. The most recent survey was conducted between June 29 and July 20, 2005 and included 125 responses.
| CBI Distributive Trade Survey | Aug 05 | July 05 | Jun 05 | May 05 | April 05 | Mar 05 | Feb 05 | Jan 05 |
|---|---|---|---|---|---|---|---|---|
| Retail Trade Sales Volume | ||||||||
| Expected | -17 | -18 | 5 | 1 | 3 | 14 | 7 | 8 |
| Reported | -18 | -19 | -7 | -14 | -9 | 2 | -3 | |
| Wholesale Trade Sales Volume | ||||||||
| Expected | 10 | 25 | 23 | 16 | -7 | -4 | 15 | 6 |
| Reported | 22 | 32 | 24 | 2 | -17 | 9 | 28 | |
| Motor Trade Sales Volume | ||||||||
| Expected | -4 | 2 | 7 | 6 | -5 | 4 | 7 | -4 |
| Reported | 3 | 7 | 8 | -7 | -16 | 2 | -9 | |
| Growth in Annual Sales Volume--Reported | ||||||||
| Grocers | 21 | 31 | 77 | 20 | 31 | 19 | 4 | |
| Furniture and Carpets | -92 | -84 | -77 | -58 | -72 | 6 | -16 |


