 Global| Jun 06 2005
UK Survey of Jobs Reveals Softening in the Labor Market
Summary
Despite small increases in the demand for and in placements of permanent staff in recent months, the job market in the United Kingdom has been easing for about a year as revealed in The Survey of Jobs conducted by NTC Research on [...]

Despite small increases in the demand for and in placements of permanent staff in recent months, the job market in the United Kingdom has been easing for about a year as revealed in The Survey of Jobs conducted by NTC Research on behalf of the Recruitment and Employment Confederation and Deloitte & Touche LLP. These data are found in the Haver database entitled UKSRVYS.
There are four general aspects of the labor market covered by The Survey of Jobs: recruitment, demand, availability and wages and salaries. And for each of these, diffusion indexes are calculated for both permanent and temporary staff.
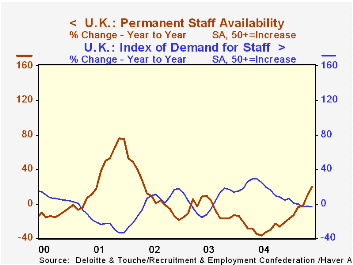
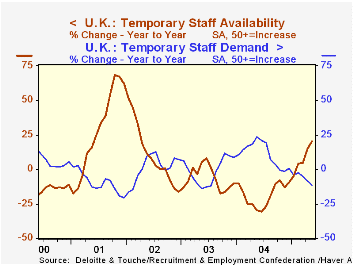
Typical of late cyclical trends, as the demand for labor weakens, the supply increases. In May, 2005, the index for the demand for temporary staff was almost 12% below May of 2004. At the same time the index for the availability of temporary staff was more than 20% above May of 2004. While the demand for permanent staff is only about 3% below last year's comparable figure, the increase in the availability of permanent staff is almost as high as that of temporary staff. The two charts show these inverse relationships for temporary and permanent staff.
Other signs of weakness in the labor market are the declines in the diffusion indexes for wages and salaries for both permanent and temporary staff. Although these indexes are above the 50 mark, indicating that more people believe they are rising than those who believe they are falling, the indexes are below levels reached a year ago.
| Diffusion Indexes | May 05 | Apr 05 | May 04 | M/M% | Y/Y% | 2004 | 2003 | 2002 |
|---|---|---|---|---|---|---|---|---|
| Demand for Jobs | ||||||||
| Permanent staff | 59.5 | 59.2 | 61.2 | 0.51 | -2.78 | 61.5 | 52.6 | 51.3 |
| Temporary staff | 56.0 | 56.6 | 63.4 | -1.06 | -11.67 | 61.5 | 55.3 | 56.3 |
| Availability for Jobs | ||||||||
| Permanent staff | 46.3 | 44.5 | 38.7 | 4.04 | 19.64 | 40.8 | 55.6 | 59.4 |
| Temporary staff | 50.0 | 48.4 | 41.5 | 3.95 | 20.48 | 43.8 | 54.3 | 58.0 |
| Wages and Salaries | ||||||||
| Permanent staff | 58.0 | 60.3 | 59.7 | -3.81 | -2.85 | 5.88 | 54.3 | 51.6 |
| Temporary staff | 55.3 | 55.7 | 59.2 | -0.72 | -6.59 | 57.9 | 52.7 | 51.7 |
| Recruitment Activity | ||||||||
| Placement of Permanent Staff | 56.3 | 55.9 | 59.1 | 0.72 | -4.74 | 59.0 | 53.4 | 52.0 |
| Billings from temporary and contract staff | 53.2 | 53.3 | 60.7 | -0.19 | -12.36 | 59.1 | 53.3 | 53.5 |
| Temporary staff margins | 49.2 | 49.7 | 48.2 | -1.01 | 2.07 | 48.7 | 45.9 | 45.9 |


