U.S. Construction Spending Rebounds in February, the Fourth M/M Gain in Five Months
Summary
- Construction spending +0.7% m/m (+2.9% y/y) in Feb. vs. -0.5% m/m (+2.7% y/y) in Jan.
- Residential private construction recovers 1.3% m/m, up for the fourth month in five, led by a 2.0% gain in home improvement building.
- Nonresidential private construction rebounds 0.4% m/m, up for the third month in four.
- Public sector construction increases 0.2% m/m, reflecting a 0.2% rise in both residential & nonresidential public buildings.
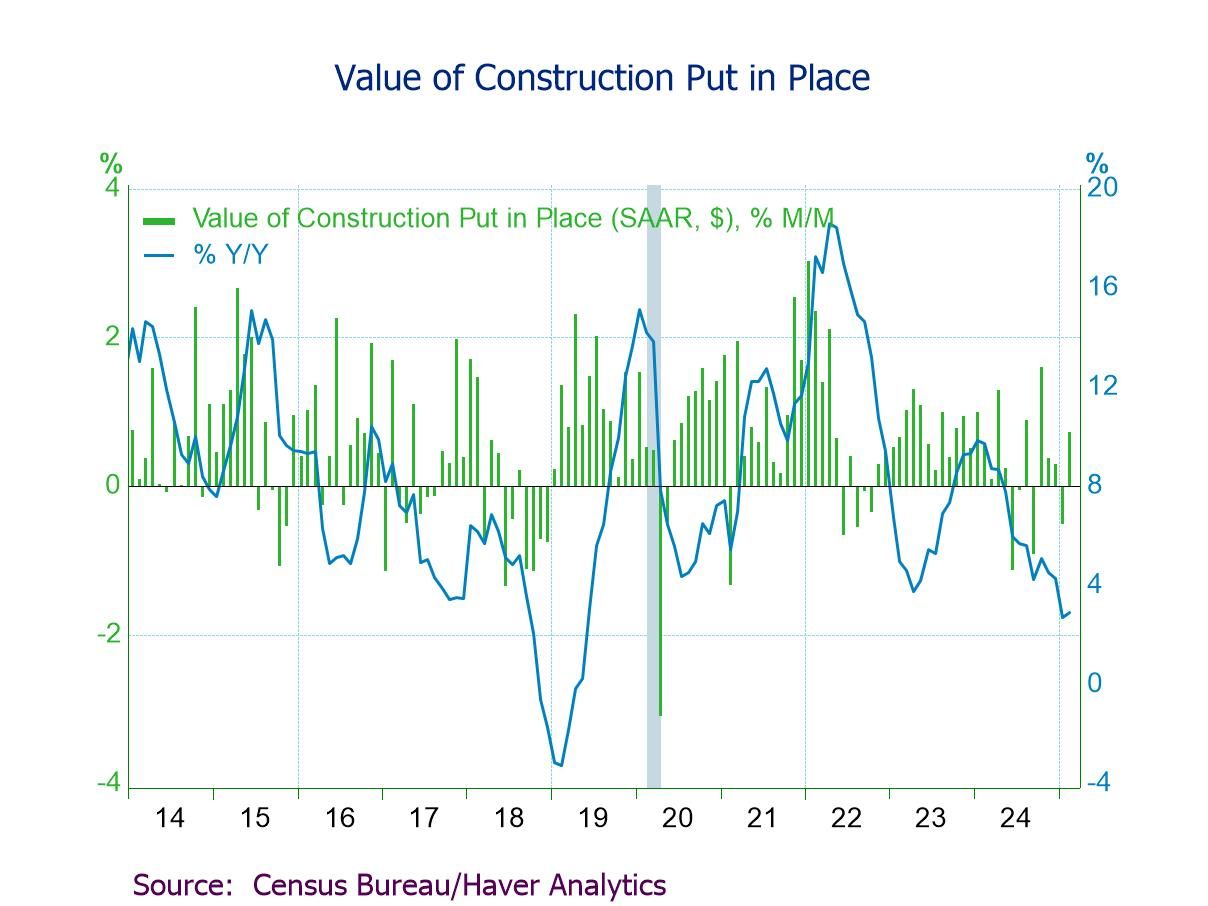

The value of construction put in place rose a more-than-expected 0.7% m/m in February after a 0.5% decline in January (-0.2% initially) and a 0.3% increase in December (+0.5% previously), data from the U.S. Census Bureau showed. The February reading was the fourth m/m rise in five months. A 0.3% m/m February rise had been expected in the Action Economics Forecast Survey. The year-on-year rate rose to 2.9% in February after decelerating to 2.7% in January (the lowest since May 2019). The latest y/y figure was lower than 9.7% in February 2024, having remained below its recent high of 9.8% in January 2024 and a peak of 18.6% in April 2022.
Private construction recovered 0.9% (2.0% y/y) in February, up for the fourth month in five, after a 0.7% decrease in January (-0.2% initially) and a 0.4% rise in December (+0.7% previously). Residential private construction rebounded 1.3% (1.6% y/y) in February, the fourth m/m increase in five months, after a 1.2% decline in January (-0.4% initially). Home improvement building rose 2.0% (8.9% y/y), the first m/m rise since November, following a 3.8% January drop; it was 40.1% of the residential private construction. Single-family building grew 1.0% (-0.1% y/y), the sixth consecutive m/m gain, after a 1.0% January rise; it was 47.4% of the residential private construction. Meanwhile, multi-family building was virtually unchanged m/m (-11.6% y/y) in February following 14 straight m/m decreases; it was 12.5% of the residential private construction.
Nonresidential private construction rose 0.4% (2.5% y/y) in February, the third m/m rise in four months, following a 0.2% decline in January (0.0% initially) and a 0.5% increase in December (+0.1% previously). The February rise reflected m/m increases in the following nonresidential private constructions. These included religious (4.2%; 14.9% y/y), amusement & recreation (2.6%; 7.3% y/y), commercial (0.9%; -5.0% y/y), educational (0.4%; -0.1% y/y), transportation (0.3%; 10.6% y/y), office (0.2%; 3.7% y/y), manufacturing (0.1%; 4.7% y/y), and utilities (0.1%; 5.0% y/y). In contrast, lodging private construction, the only category with a monthly decline in February, fell 0.4% (-0.2% y/y), the fourth m/m fall in five months, after a 0.1% January easing. Meanwhile, communication private construction (-0.03%; +3.6% y/y) and health care private construction (+0.03%; -0.9% y/y) were virtually unchanged m/m in February.
The value of public construction grew 0.2% (6.0% y/y) in February, the seventh m/m gain in eight months, on top of a 0.2% rise in January (+0.1% initially), reflecting a 0.2% rebound (2.5% y/y) in residential public construction and a 0.2% increase (6.1% y/y) in nonresidential public construction. The February gain reflected m/m rises in the following nonresidential public constructions. These included commercial (4.1%; 53.1% y/y), conservation & development (2.4%; 8.2% y/y), water supply (1.4%; 15.6% y/y), health care (1.3%; 14.8% y/y), amusement & recreation (0.3%; 20.4% y/y), and educational (0.3%; 8.4% y/y). Notably, spending on highways & streets, which made up 28.9% of public construction spending, rose 1.2% (0.2% y/y) in February after a 0.8% increase in January, registering the fourth successive m/m rise and the sixth in seven months. To the downside, the following public constructions fell m/m in February: office (-2.8%; +1.3% y/y), utilities (-1.3%; -7.1% y/y), public safety (-1.2%; +4.3% y/y), transportation (-1.2%; +4.1% y/y), and sewage & waste disposal (-1.1%; +11.1% y/y).
The construction figures can be found in Haver's USECON database. The expectations figure is from the Action Economics Forecast Survey in AS1REPNA.


Winnie Tapasanun
AuthorMore in Author Profile »Winnie Tapasanun has been working for Haver Analytics since 2013. She has 20+ years of working in the financial services industry. As Vice President and Economic Analyst at Globicus International, Inc., a New York-based company specializing in macroeconomics and financial markets, Winnie oversaw the company’s business operations, managed financial and economic data, and wrote daily reports on macroeconomics and financial markets. Prior to working at Globicus, she was Investment Promotion Officer at the New York Office of the Thailand Board of Investment (BOI) where she wrote monthly reports on the U.S. economic outlook, wrote reports on the outlook of key U.S. industries, and assisted investors on doing business and investment in Thailand. Prior to joining the BOI, she was Adjunct Professor teaching International Political Economy/International Relations at the City College of New York. Prior to her teaching experience at the CCNY, Winnie successfully completed internships at the United Nations. Winnie holds an MA Degree from Long Island University, New York. She also did graduate studies at Columbia University in the City of New York and doctoral requirements at the Graduate Center of the City University of New York. Her areas of specialization are international political economy, macroeconomics, financial markets, political economy, international relations, and business development/business strategy. Her regional specialization includes, but not limited to, Southeast Asia and East Asia. Winnie is bilingual in English and Thai with competency in French. She loves to travel (~30 countries) to better understand each country’s unique economy, fascinating culture and people as well as the global economy as a whole.
More Economy in Brief


 Global| Feb 05 2026
Charts of the Week: Balanced Policy, Resilient Data and AI Narratives
by:Andrew Cates

