U.S. GDP Growth Strengthens in Q2’24; Rise in Price Index Slows
by:Tom Moeller
|in:Economy in Brief
Summary
- Growth doubles the Q1 increase.
- Inventories & government spending lead growth.
- Consumer spending & business investment gains improve.
- Price increase moderates.


Real GDP grew 2.8% (SAAR) in Q2’24 in the second quarter of 2024. The gain followed unrevised increases of 1.4% in Q1’24 and 3.4% in Q4’23. A 1.9% increase had been expected in the Action Economics Forecast Survey. Real GDP grew 3.1% y/y, roughly the same as during the prior three quarters.
The contributions to GDP growth from business inventories and international trade produced offsetting influences on growth last quarter. The change in inventories added 0.82 percentage point to growth last quarter following a 0.42 subtraction in Q1 and a 0.47 subtraction in Q4. Offsetting the latest influence, net exports subtracted 0.72 percentage point from growth after subtracting 0.65 percentage point in Q1. Exports of goods & services grew 2.0% (3.5% y/y) following a 1.6% rise in Q1. Imports jumped 6.9% (4.9% y/y) after rising 6.1% in Q1.
Real final sales to domestic purchasers grew 2.7% (3.0% y/y) in Q2 following a 2.4% Q1 gain. Government sector spending increased 3.1% (3.8% y/y) after rising 1.8%. Federal government spending growth paced the gain with a 3.9% rise (3.2% y/y) after a 0.2% easing in Q1. National defense investment grew 5.2% (3.2% y/y) after falling 0.9%. State & local government spending improved 2.6% (4.1% y/y) after a 3.0% rise.
Private sector final demand growth held steady last quarter at 2.6% (2.9% y/y). Personal consumption expenditures rose 2.3% (2.5% y/y) after increasing 1.5% in Q1, adding 1.6 percentage point to Q2 growth. Durable goods spending posted a 4.7% rise (2.4% y/y) last quarter and recovered the 4.4% decline in Q1. Motor vehicle expenditures rose 4.8% (-3.3% y/y) after declining 14.0%. Furniture & appliance buying rose 7.0% (3.6% y/y) after a 0.3% gain in Q1. Recreational goods & vehicle purchases increased 4.8% (6.5% y/y) after falling 2.4% in Q1. Spending on other durable goods rose 0.5% (6.8% y/y) after rising 10.8% in Q1.
Nondurable goods outlays increased 1.4% (1.7% y/y) after falling 1.1% in the first quarter. Apparel outlays declined 3.0% (+2.5% y/y) after a 3.4% increase while food & beverage spending rose 1.8% (1.1% y/y) following a 0.2% slip. Outlays on gasoline & other energy products increased 6.1% (-0.8% y/y) after declining 11.5% in Q1. Spending on other nondurable goods rose 1.1% (2.9% y/y) after no change in the first quarter.
Spending on services increased 2.2% last quarter (2.8% y/y) after a 3.3% gain. Housing & utilities outlays rose 1.5% (1.4% y/y) after a 1.0% Q1 improvement. Health care purchases increased 4.0% (5.4% y/y) following a 7.2% gain. Transportation services outlays growth of 3.9% (2.3% y/y) compared to 0.3% in the previous quarter. Spending at restaurants & on hotel accommodations gained 1.0% (2.7% y/y) after falling 3.3% while growth in recreation outlays jumped 4.1% (2.4% y/y) after a 2.8% Q1 gain.


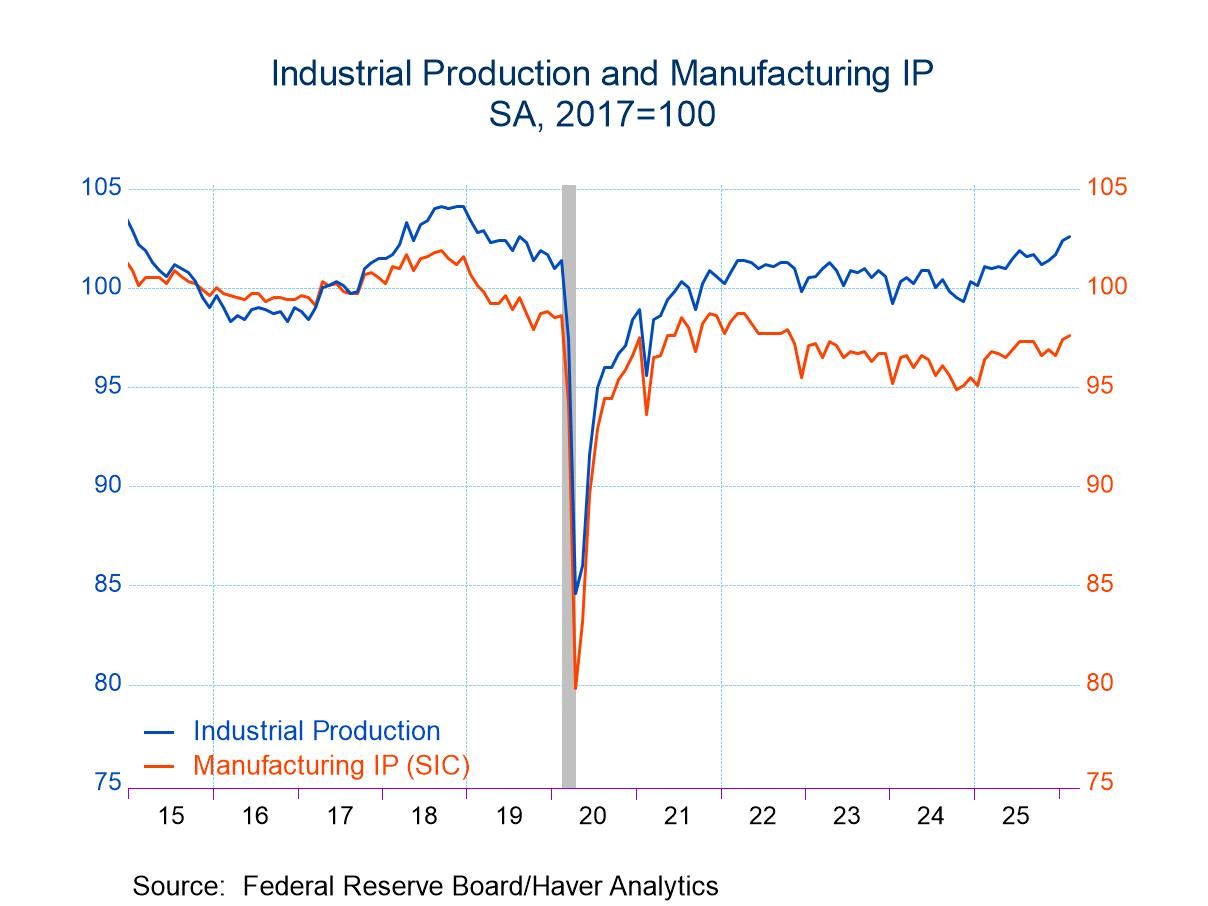
Business fixed investment increased 5.2% (3.7% y/y) last quarter following a 4.4% Q1 rise. It accounted for 0.7 percentage point of GDP growth. Spending on nonresidential structures declined 3.4% (+5.3% y/y) after a 3.4% Q1 rise. Equipment investment strengthened 11.6% (1.8% y/y) after rising 1.6% in Q1. Transportation equipment spending surged 49.8% (-1.4% y/y) after an 18.1% decline. Information processing investment strengthened 10.2% (5.1% y/y) after a 6.8% rise, while industrial equipment outlays fell 3.2% (+0.8% y/y) after strengthening 12.8% in Q1. Investment in intellectual property products increased 4.5% (4.6% y/y) after a 7.7% Q1 rise.
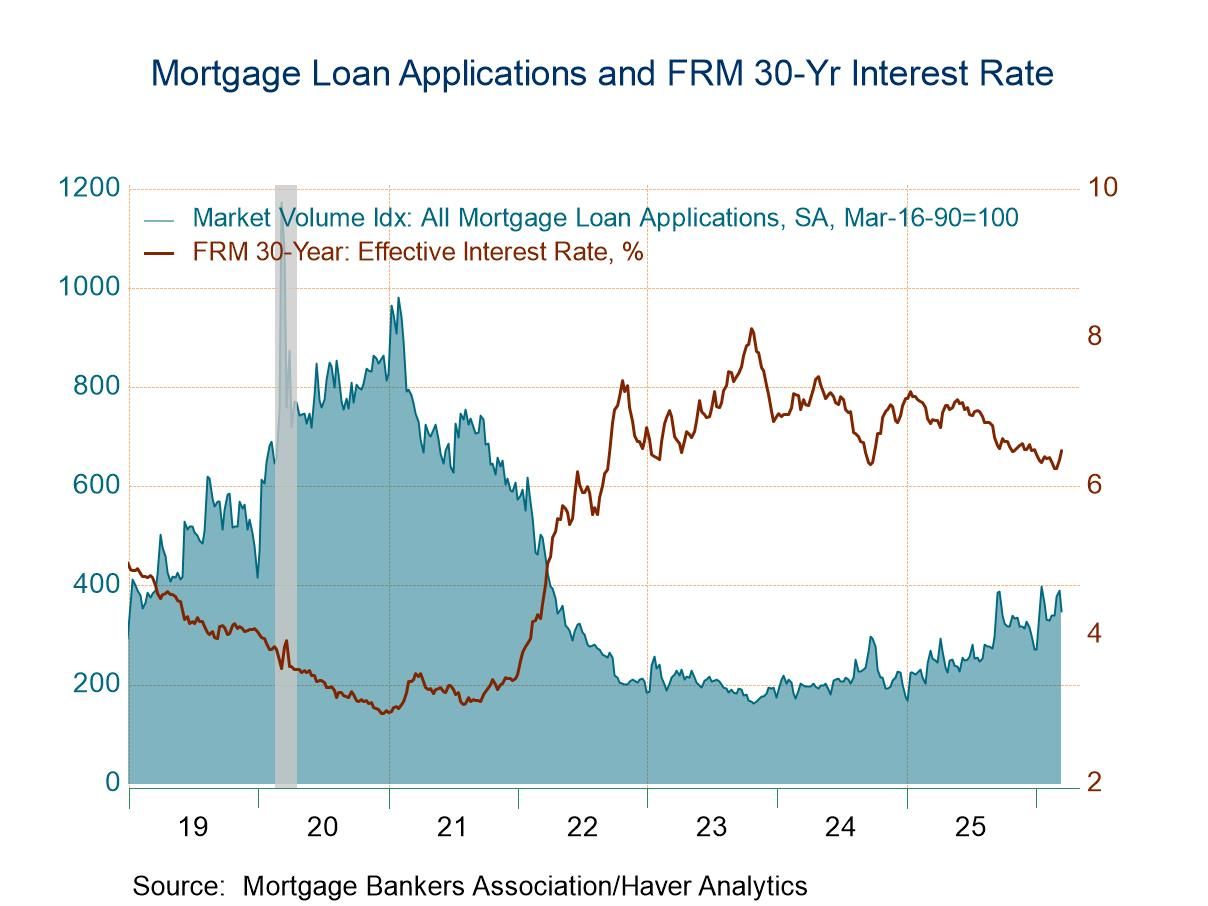
Residential structures investment declined 1.4% (+5.8% y/y) in Q2 following three consecutive quarters of strong increase.
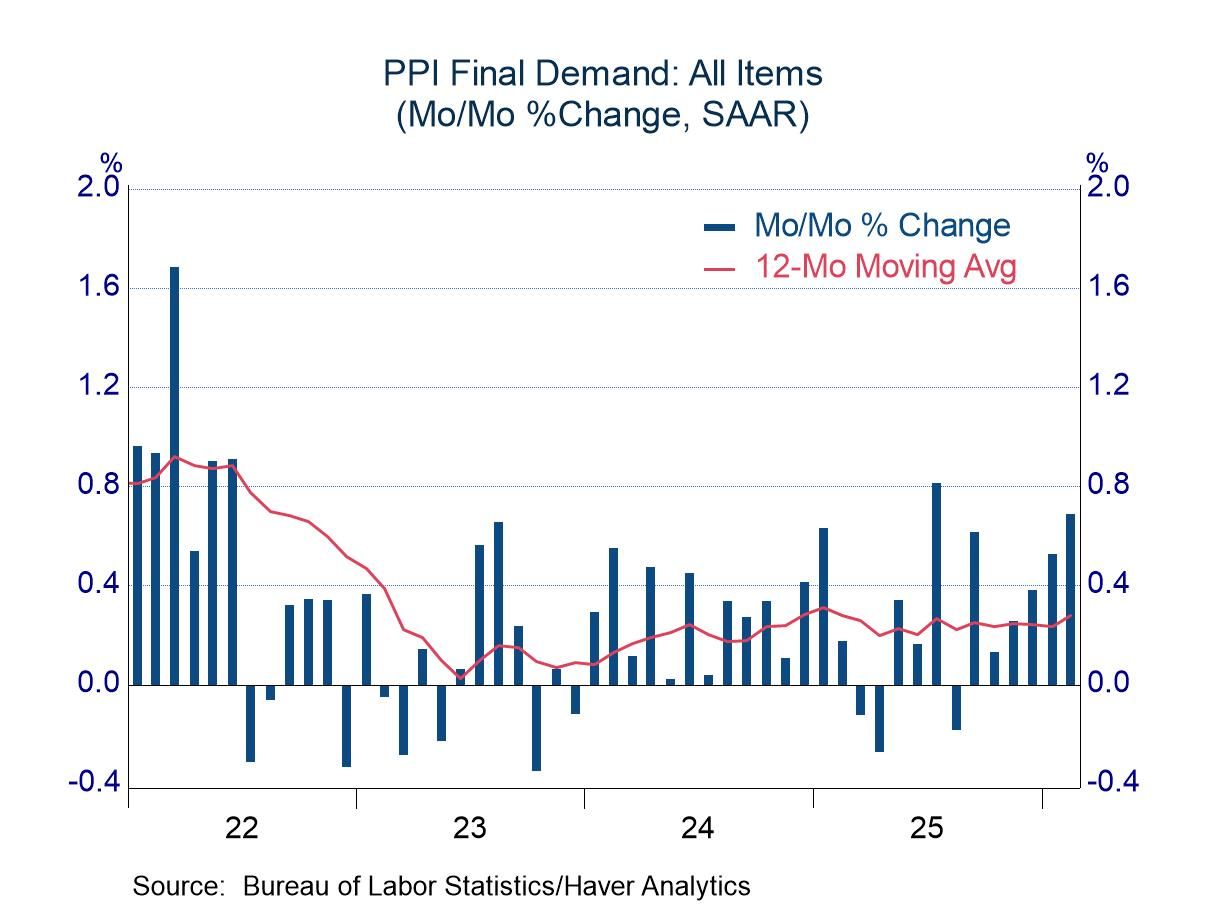
The GDP chain price index rose 2.3% (2.6% y/y) last quarter after a 3.1% Q1 gain. The rise compared to an expected 2.6%. The PCE price index increased 2.6% both q/q and y/y, after a 3.4% rise in Q1. The PCE price index excluding food and energy rose 2.9% (2.7% y/y) after increasing 3.7%. The PCE goods price index rose 0.7% (-0.1% y/y) after falling in both of the prior two quarters while the services price index rose 3.6% (4.0% y/y) after a 5.4% rise. The PCE services price index less energy & housing rose 3.3% (3.5% y/y) after a 5.1% rise.
The business fixed investment price index rose 1.4% (1.5% y/y) following a 1.8% gain. The residential investment price index improved 3.1% (3.0% y/y) following no change. The government spending price index rose 1.8% (3.2% y/y) after rising 3.9% in the first quarter.
The GDP data can be found in Haver’s USECON and USNA databases. USNA contains virtually all of the Bureau of Economic Analysis detail in the national accounts. The Action Economics consensus estimates can be found in AS1REPNA.


Tom Moeller
AuthorMore in Author Profile »Prior to joining Haver Analytics in 2000, Mr. Moeller worked as the Economist at Chancellor Capital Management from 1985 to 1999. There, he developed comprehensive economic forecasts and interpreted economic data for equity and fixed income portfolio managers. Also at Chancellor, Mr. Moeller worked as an equity analyst and was responsible for researching and rating companies in the economically sensitive automobile and housing industries for investment in Chancellor’s equity portfolio. Prior to joining Chancellor, Mr. Moeller was an Economist at Citibank from 1979 to 1984. He also analyzed pricing behavior in the metals industry for the Council on Wage and Price Stability in Washington, D.C. In 1999, Mr. Moeller received the award for most accurate forecast from the Forecasters' Club of New York. From 1990 to 1992 he was President of the New York Association for Business Economists. Mr. Moeller earned an M.B.A. in Finance from Fordham University, where he graduated in 1987. He holds a Bachelor of Arts in Economics from George Washington University.
More Economy in Brief