When the Balances Stop Balancing
In the global economy, nothing ever balances itself — it must be balanced. And the tool we use to understand that process is the financial balances identity:
(Private Sector Balance) + (Government Balance) + (Current Account Balance) = 0
This deceptively simple equation reminds us that the financial positions of households, businesses, governments, and the rest of the world are always interlinked — one sector’s deficit must be matched by a surplus elsewhere. But when policies distort trade and capital flows, they don’t eliminate this identity. They just shift the burden of adjustment — often suddenly and painfully — to another part of the system.
We’re now entering such a phase. As we explored in a previous piece (see the bond market and productivity), the global economy is confronting overlapping questions about how — and where — capital will be absorbed. That blog argued that it’s not simply a question of whether savings adjust (they must), but rather what mix of prices, policies, and expectations will force that adjustment — particularly as governments and firms simultaneously reach for the same pool of private capital to fund deficits and an AI-driven capex surge.
These concerns sit at the heart of what this next piece explores. Around the world, governments are pulling financial levers in conflicting directions. The United States is simultaneously contemplating financial transaction taxes, introducing punitive investment measures, and expanding fiscal deficits. Europe is loosening its purse strings in the name of strategic autonomy, while fast-tracking plans for a Savings and Investment Union that would re-anchor more capital within its borders. And China, still deeply mercantilist, is doubling down on export-led growth, capital controls, and state-directed investment — while keeping domestic consumption artificially suppressed.
Overlaying all this is a sharp resurgence in protectionist trade policy, with the United States now imposing tariffs across a wide swathe of imports. These frictions are not just policy noise — they are tearing at the global capital recycling mechanisms that once allowed persistent imbalances to be absorbed without systemic rupture.
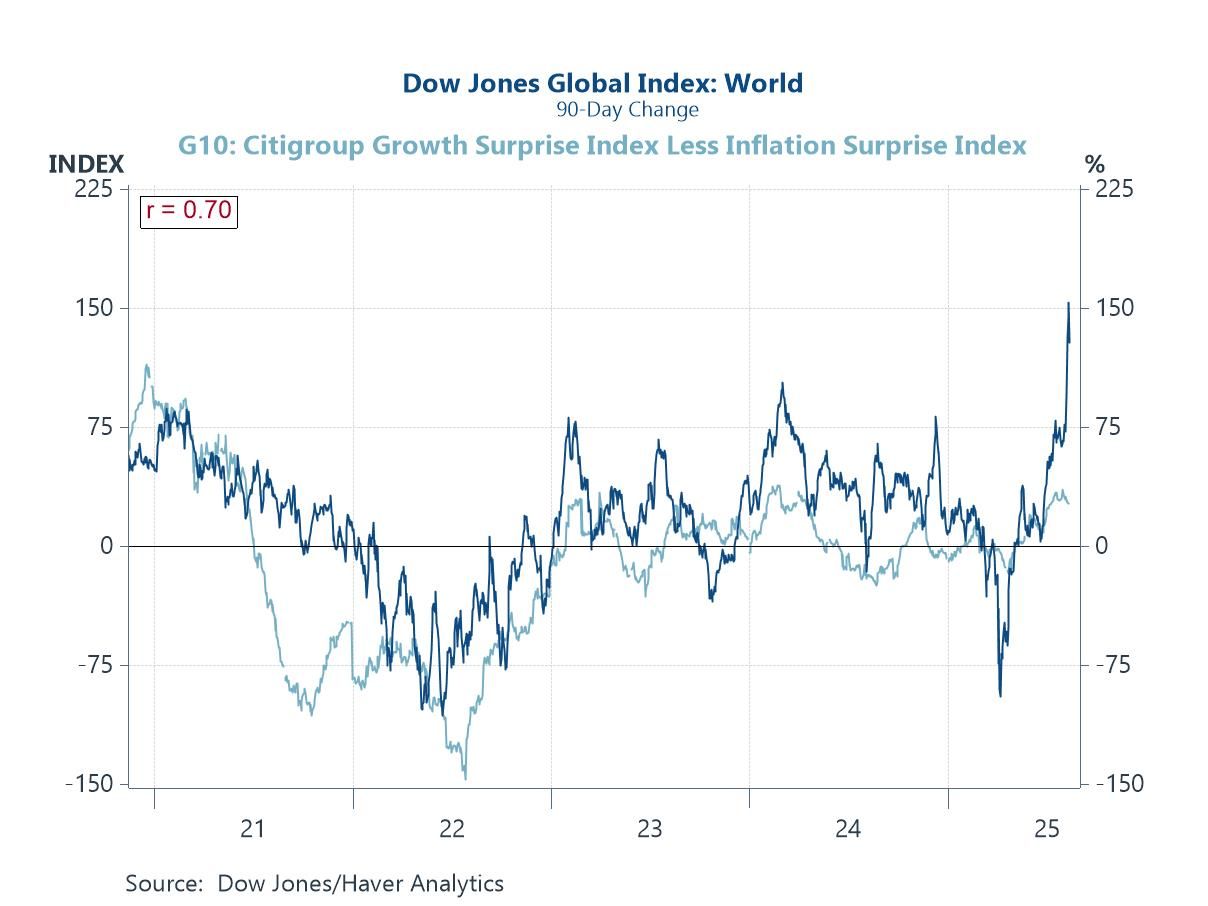
As we wrote last time, markets may be pricing in an AI-led productivity renaissance — but if that narrative falters or is undercut by misaligned financial flows, the repricing could be swift and severe. And here’s the real concern: the fragile scaffolding that once allowed the world to function with these imbalances is now being dismantled — leaving a system where capital is needed in one place, unwanted in another, and increasingly blocked from flowing freely.
The United States Closes the Financial Tap
Suppose the US implements a tax on financial transactions or introduces new restrictions on foreign portfolio investment. This would mark a sharp reversal from decades of financial openness, fundamentally challenging the US model of attracting global capital to fund persistent fiscal and current account deficits.
Recent policy proposals, including those under the so-called "Big Beautiful Budget" clause and Section 899 of the Internal Revenue Code, point to a new willingness to weaponize financial channels. Section 899 allows for punitive taxation—so-called "revenge taxes"—on investors from countries deemed to have imposed discriminatory measures against the US. These steps create uncertainty for foreign capital and increase the risk premium on US assets.
If capital inflows shrink, the identity demands that either:
• The current account deficit shrinks (via export gains or import compression),
• The government deficit shrinks (unlikely given current policy), or
• The private sector saves more than it invests.
This would strain the US economy. The dollar would likely weaken. Treasuries might lose some of their safe haven appeal, especially if yields rise to compensate for reduced foreign demand. Liquidity premia would widen. The US could no longer rely on the rest of the world to finance its deficits cheaply and reliably.
US Fiscal Expansion Without Financing
Now consider a parallel development: a renewed US fiscal expansion driven by tax cuts and defence spending. The federal deficit widens further. But with capital inflows potentially constrained, the private sector—households and corporations—must absorb the gap.
This creates a contradiction. Expansionary fiscal policy often tends to reduce household saving (more income, more consumption) and encourages firms to invest. But the financial balances identity demands the opposite: that the private sector save more to offset government dissaving and a flat or shrinking current account.
If private savings don’t rise, interest rates must. The result: pressure on equity and bond markets, and a risk that the US enters a cycle of high borrowing costs just as its productive potential hinges on long-term investment.

 Global