 Global| May 04 2006
1Q U.S. Productivity Improved, Profits' Implication Good
by:Tom Moeller
|in:Economy in Brief
Summary
Non-farm labor productivity growth last quarter improved to 3.2% from the 0.3% decline during the final quarter of 2005. The increase beat Consensus expectations for a 2.8% rise and also represented improvement from the average [...]
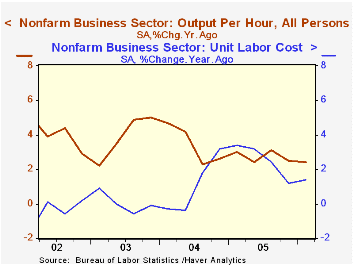
Non-farm labor productivity growth last quarter improved to 3.2% from the 0.3% decline during the final quarter of 2005. The increase beat Consensus expectations for a 2.8% rise and also represented improvement from the average quarterly growth rates during 2004 (2.7%) and 2005 (2.5%).
Output growth surged to 5.8% (4.1% y/y) from just 1.5% during 4Q. That surge was on the back of only a 2.5% (1.7% y/y) rise in hours worked after a 1.8% increase the prior quarter.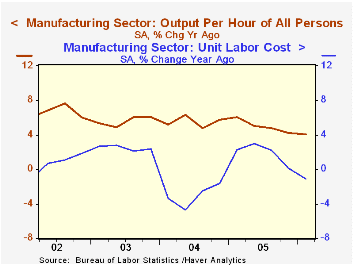
Unit labor cost growth of 2.5% was slower than the 4Q increase but nevertheless represented an acceleration in labor cost pressures from a quarterly average of 1.3% during 2005.
Factory sector productivity grew 4.2% (4.1% y/y), right on the firm 4.3% quarterly pace of last year. Compensation grew just 1.5% (3.0% y/y). Therefore unit labor costs in the factory sector declined for the third of the last four quarters, off 2.6% (-1.1% y/y) during 1Q06.
A Leaner, More Skilled U.S. Manufacturing Workforce from the Federal Reserve Bank of New York is available here.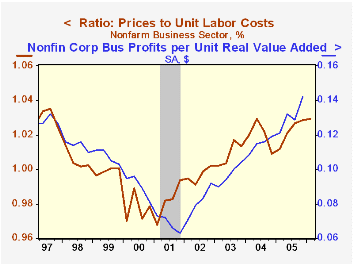
The implicit price deflator for the nonfarm business sector rose 2.8% (3.1% y/y) after a 3.6% jump during 4Q05.The rise lifted the ratio of prices to unit labor costs to near the highest level since 1997. During the last ten years there has been an 81% correlation between this ratio and corporate profit margins.
In Why Did U.S. Market Hours Boom in the 1990s?, the Federal Reserve Bank of Minneapolis examines the impact of longer hours worked on productivity & profits. The paper can be found here.
| Non-farm Business Sector (SAAR) | 1Q '06 | 4Q '05 | Y/Y | 2005 | 2004 | 2003 |
|---|---|---|---|---|---|---|
| Output per Hour | 3.2% | -0.3% | 2.4% | 2.7% | 3.4% | 3.9% |
| Compensation per Hour | 5.7% | 2.7% | 3.8% | 5.4% | 4.6% | 4.0% |
| Unit Labor Costs | 2.5% | 3.0% | 1.4% | 2.5% | 1.1% | 0.0% |

Tom Moeller
AuthorMore in Author Profile »Prior to joining Haver Analytics in 2000, Mr. Moeller worked as the Economist at Chancellor Capital Management from 1985 to 1999. There, he developed comprehensive economic forecasts and interpreted economic data for equity and fixed income portfolio managers. Also at Chancellor, Mr. Moeller worked as an equity analyst and was responsible for researching and rating companies in the economically sensitive automobile and housing industries for investment in Chancellor’s equity portfolio. Prior to joining Chancellor, Mr. Moeller was an Economist at Citibank from 1979 to 1984. He also analyzed pricing behavior in the metals industry for the Council on Wage and Price Stability in Washington, D.C. In 1999, Mr. Moeller received the award for most accurate forecast from the Forecasters' Club of New York. From 1990 to 1992 he was President of the New York Association for Business Economists. Mr. Moeller earned an M.B.A. in Finance from Fordham University, where he graduated in 1987. He holds a Bachelor of Arts in Economics from George Washington University.
More Economy in Brief

 Global| Feb 05 2026
Charts of the Week: Balanced Policy, Resilient Data and AI Narratives
by:Andrew Cates

