 Global| Dec 06 2005
3Q U.S. Productivity Revised Up, 2Q Compensation Lower
by:Tom Moeller
|in:Economy in Brief
Summary
Non-farm labor productivity growth for 3Q was revised higher to 4.7% versus the initial estimate of a 4.1% gain. Consensus expectations had been for a revision to 4.5%. The strength of these increases is impressive given that three [...]
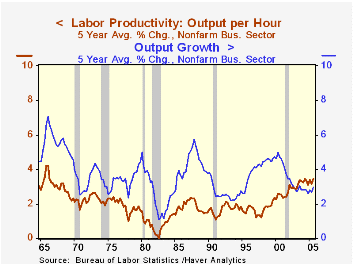
Non-farm labor productivity growth for 3Q was revised higher to 4.7% versus the initial estimate of a 4.1% gain. Consensus expectations had been for a revision to 4.5%. The strength of these increases is impressive given that three hurricanes hit the Gulf Coast last quarter. Further evidence of strength is the comparison to the five year average of 3.4% growth. The recent trend rate of increase is the strongest since the mid 1960s.
Notable is that the trend in productivity exceeds average output growth of 2.9% during the last five years. For 3Q, output growth was revised up to 4.8% (4.4% y/y) from 4.2% reported initially. The estimate of hours worked last quarter was unrevised at 0.1% (1.2% y/y).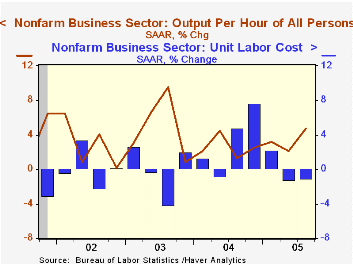
Compensation costs were little revised for 3Q at 3.7% (5.0 y/y) but the 2Q gain was revised sharply lower to 0.9%. As a result, unit labor costs fell 1.0% following a revised 1.2% decline in 2Q.
Factory sector productivity growth was revised lower for 3Q to 3.4% (4.5% y/y) from 4.5%. Compensation growth was little revised at 3.1% (6.2% y/y) and the 0.3% (+1.7% y/y) decline in unit labor costs followed a revised 2Q drop.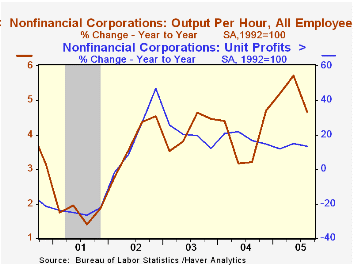
Productivity in the nonfinancial corporate sector for 3Q, reported for the first time, grew 3.2% (4.7% y/y) versus 4.3% growth in 2Q which was revised down. In fact, the estimate of y/y productivity growth through 2Q was lowered substantially to 4.3% from 6.3% due to a lowered estimate of output, however, compensation growth was lowered as well. Unit labor costs rose 1.3% in 3Q (0.7% y/y) as output grew 4.0% (6.0% y/y). Nonfinancial corporate sector output is gleaned from the income side of the National Income & Product Accounts (NIPA) as opposed to the non-farm output figures which are derived from the output side of the NIPA. Factory sector output is derived from the industrial production measures compiled by the Federal Reserve Board.
The implicit price deflator for nonfarm business was little revised at 3.1% (2.8% y/y). The increase lifted the ratio of prices to unit labor costs to its highest since 1997. During the last ten years there has been a 60% correlation between the ratio and the y/y growth in operating corporate profits.
| Non-farm Business Sector (SAAR) | 3Q '05 | 3Q '05 | 2Q '05 | Y/Y | 2004 | 2003 | 2002 |
|---|---|---|---|---|---|---|---|
| Output per Hour | 4.7% | 4.1% | 2.1% | 3.1% | 3.4% | 3.8% | 4.0% |
| Compensation | 3.7% | 3.6% | 0.9% | 5.0% | 4.5% | 4.0% | 3.5% |
| Unit Labor Costs | -1.0% | -0.5% | -1.2% | 1.8% | 1.1% | 0.2% | -0.5% |

Tom Moeller
AuthorMore in Author Profile »Prior to joining Haver Analytics in 2000, Mr. Moeller worked as the Economist at Chancellor Capital Management from 1985 to 1999. There, he developed comprehensive economic forecasts and interpreted economic data for equity and fixed income portfolio managers. Also at Chancellor, Mr. Moeller worked as an equity analyst and was responsible for researching and rating companies in the economically sensitive automobile and housing industries for investment in Chancellor’s equity portfolio. Prior to joining Chancellor, Mr. Moeller was an Economist at Citibank from 1979 to 1984. He also analyzed pricing behavior in the metals industry for the Council on Wage and Price Stability in Washington, D.C. In 1999, Mr. Moeller received the award for most accurate forecast from the Forecasters' Club of New York. From 1990 to 1992 he was President of the New York Association for Business Economists. Mr. Moeller earned an M.B.A. in Finance from Fordham University, where he graduated in 1987. He holds a Bachelor of Arts in Economics from George Washington University.
More Economy in Brief

 Global| Feb 05 2026
Charts of the Week: Balanced Policy, Resilient Data and AI Narratives
by:Andrew Cates

