 Global| Mar 27 2006
Another Indication of the End of Deflation in Japan: Prices of Commercial Land Rise in Metropolitan Areas
Summary
Further evidence that deflation in Japan is becoming a thing of the past is showing up in land prices. Commercial land prices in the three metropolitan areas--Tokyo, Osaka and Nagoya--rose last year for the first time since the peak [...]

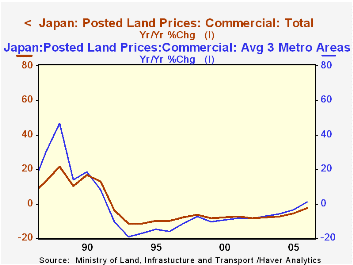
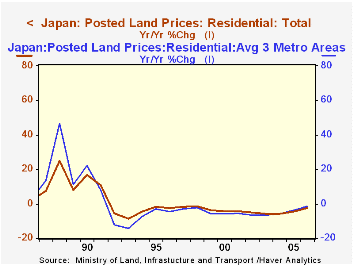
Further evidence that deflation in Japan is becoming a thing of the past is showing up in land prices. Commercial land prices in the three metropolitan areas--Tokyo, Osaka and Nagoya--rose last year for the first time since the peak in Japan's land prices was reached in the first half of 1991. After fourteen years of ever lower prices, the price of commercial land in the three metropolitan areas rose 1.0% in 2005.Nationwide, prices of commercial land were still falling, but the decline has been decelerating and in 2005 was 2.7% versus 5.6% the year before. The first chart shows the annual percentage changes in the prices of commercial land in the three metropolitan areas and in the nation as a whole for the past twenty years.Residential land prices have not yet shown an increase but the declines have been moderating both in the metropolitan areas and in the nation as a whole, as the second chart shows.
These price changes are published by the Department of Land, Infrastructure and Transport annually. Percentage changes from a year ago are shown on January 1st of each year, the latest being January 1, 2006. Indexes of urban land prices (End of March =100) are compiled and published by the Japan Real Estate Institute semiannually in March and September. The March figure is representative of the first half of the year and the September figure, the second half. The index of is based on conditions in some 223 cities.
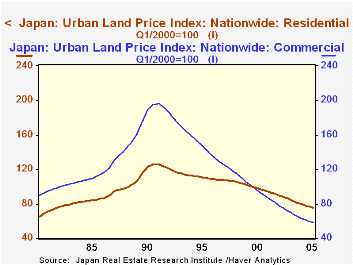
The indexes give a good picture of the rise and fall of land prices in urban areas. The rise of land prices in the boom of the eighties was more pronounced in commercial land prices than in residential land prices. Between 1980 and 1991 commercial land prices rose almost 130% and have subsequently declined 70%. The index of commercial land prices was 58.60 in the last half of 2005 below the level of the index in the first half of 1980. The rise in residential land prices was less, 108%, and the subsequent decline has been more muted, 40%. The Index of residential land prices was 75.60 in the last half of 2005, still above the 60.60 of the first half of 1980. The rise and fall of commercial and residential land prices are shown in the third chart.
| Percent Changes in Land Prices (%) | 2005 | 2004 | 2003 | 2002 | 2001 | 2000 |
|---|---|---|---|---|---|---|
| Commercial | ||||||
| Metropolitan Areas | 1.0 | -3.2 | -5.8 | -7.1 | 8.5 | -9.6 |
| Nationwide | -2.7 | -5.6 | -7.4 | -8.0 | -8.3 | -8.0 |
| Residential | ||||||
| Metropolitan Areas | -1.2 | -3.7 | -5.7 | -6.5 | -5.6 | -5.9 |
| Nationwide | -2.7 | -4.6 | -5.7 | -5.8 | -5.2 | -4.1 |
| Urban Land Price Index (End of March 2000=100) |
1980 | Peak 1991 | Current Second half 2005 |
1980-Peak % Change |
Peak-Current % Change |
-- |
| Commercial Land | 86.00 | 195.90 | 58.60 | 127.79 | -70.09 | -- |
| Residential Land | 60.61 | 126.10 | 75.60 | 108.09 | -40.05 | -- |
More Economy in Brief
 Global| Feb 05 2026
Charts of the Week: Balanced Policy, Resilient Data and AI Narratives
by:Andrew Cates


